We have now examined some of the new data available at http://data.cgt.duke.edu/NatureMedicine.php. Given this data, we wish to revisit two of the assertions made by Potti and Nevins in more detail. Details of our analysis are available in 6 reports (rep01-rep06), which are linked to below.
They contend that we obtained results very similar to theirs when we use metagenes created from both training and test sets to predict response to docetaxel, noting "In short, they reproduce our result when they use our methods."
We don't think we obtain their results. Figure 8 of our Supplementary Report 9 shows (a) that if we don't use the test data in our metagene assembly, we place all of the test samples in a single class, and (b) if we use both training and test data to assemble the metagene, we place some of the test samples in each of the sensitive/resistant classes. However, placing samples in two groups does not ensure that we do so correctly. We get 17/24 correct when we use the latter approach to metagene assembly, a good deal short of the 22/24 they report (rep01).
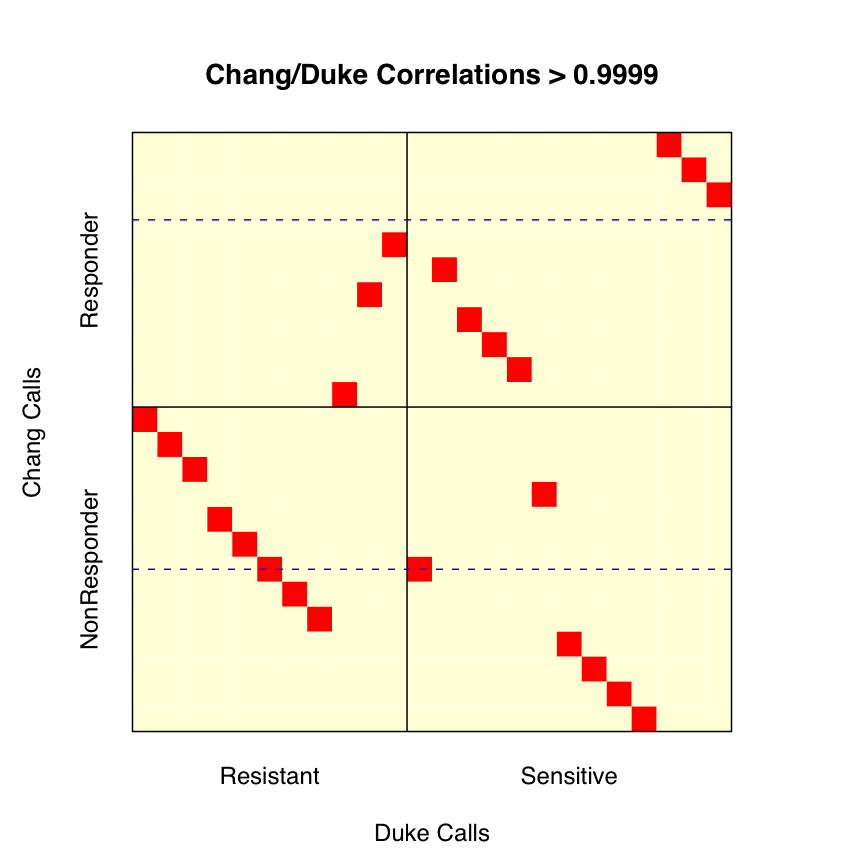
We considered the possibility that part of the discrepancy might be due to a relabeling of some of the test samples. As we noted in our correspondence, Potti et al labeled 13 of the 24 Chang et al test samples as sensitive, though Chang et al only called 11 of the 24 sensitive. Potti et al's supplementary file "Chang clinical data.doc" gives an explanation for this shift. Sensitivity was defined in terms of percent residual disease. Chang et al set the cutoff for "sensitive" at 25% residual disease, whereas Potti et al set the cutoff at 40%. Using the data Potti et al report, this results in two patients, N12 and N13, being reclassified. We checked this information against the clinical information reported by Chang et al (rep02), and found one discrepancy. According to Chang et al, patient N14 has 39% residual disease. According to Potti et al, patient N14 has 40% residual disease. Using the numbers supplied by Chang et al, there should be 14 "sensitive" patients using a 40% cutoff, not 13. Regardless of this difference in setting cutoffs, we want to see if our accuracy improves if we relabel patients N12 and N13.
This relabeling is nontrivial, as Chang et al did not supply a mapping relating the sample identifiers N1-N24 (used to describe the clinical information) to the sample identifiers GSM4901-GSM4924 (used at GEO to label the quantifications). We don't need this mapping if we use the Chang et al labels, since the "sensitive" and "resistant" data is posted in different groups --- GSE350 and GSE349, respectively, with sample GSM4913 mislabeled as resistant per Susan Hilsenbeck. Fortunately, the supplementary information from Chang et al does provide quantification values for 92 genes linked to samples N1-N24. Using these quantifications, we identified the mapping required (rep03). As a quick check, we do note that our labeling of the first 11 "sensitive" samples from Chang et al does match the grouping they supplied to GEO.
We then tried to check the labeling used by Potti et al using numbers from the new supplementary table of processed breast data supplied by Potti et al, "Breast data (n = 24).txt". This table has 14 columns for the training data and 24 columns for the test data. After using the training data to identify the processing applied, we checked the sample identities. Unfortunately, we found (rep04)
One reason our results differ from theirs is that the data posted (and presumably used) by Potti et al for docetaxel is wrong.
In point 6 of our correspondence, we note an apparent reversal of the sensitive and resistant labels applied to adriamycin. In their response, Potti and Nevins address this, commenting on "the acute lymphocytic leukemia dataset in which the labels are accurate --- full details are provided on our web page."
Of the 16 files available on their web page as of Nov 8, 2007, only one, "Adria_ALL(n = 122).txt", involves the adriamycin samples. This file contains processed data for 144 samples, 22 training and 122 validation. A note to the side (in position EP3 when the table is read into Excel) states that "Validation data is from GSE4698, GSE649, GSE650, GSE651, and others."
Potti et al's initial Nature Medicine paper named only GSE650 and GSE651, as we noted in our correspondence. These two datasets involve 94 samples labeled as sensitive and 28 samples labeled as resistant to daunorubicin (adriamycin = doxorubicin), adding up to 122 samples in all. GSE649 gives measurements for 36 samples labeled as resistant to vincristine, not adriamycin. These three GEO datasets are all linked to the paper by Holleman et al (NEJM, 2004, 351:533-542). GSE4698 involves 60 samples from children with relapsed ALL, described in Kirschner-Schwabe et al (Clin Canc Res 2006, 12:4553-4561); this last was not cited by Potti et al. Given that the total number of samples in these 4 data sets is 218, not 122, 96 (or more, if there are some columns from "others") must have been excluded.
The columns of validation data are not identified by name. We are only told (a) that they are validation samples, and (b) whether they are Resp or NR. Thus, we have no idea what specific samples are involved, which full datasets they come from (assuming that they do not come from the the catchall "and others"), or what their associated clinical information is. We think more details are required.
The data appears to be processed in the same way as the breast data discussed above, though only 8958 rows of data (not 12558) are present. This is due to the use of Chip Comparer to map from the U95Av2 training data to U133Av2 validation data. Nonetheless, we are able (with some effort) to precisely replicate the values given for the training data ( rep05), so we understand how the mapping was applied to the U95Av2 data. Lacking knowledge of the identies of the validation samples run on the U133Av2 arrays, we have not been able to come to a similar understanding of how Chip Comparer was used for these arrays.
Rather than try to map individual samples back to their initial datasets, we simply checked the pairwise correlations between columns with the idea of looking for common behaviors. What we found (rep06) is shown below.
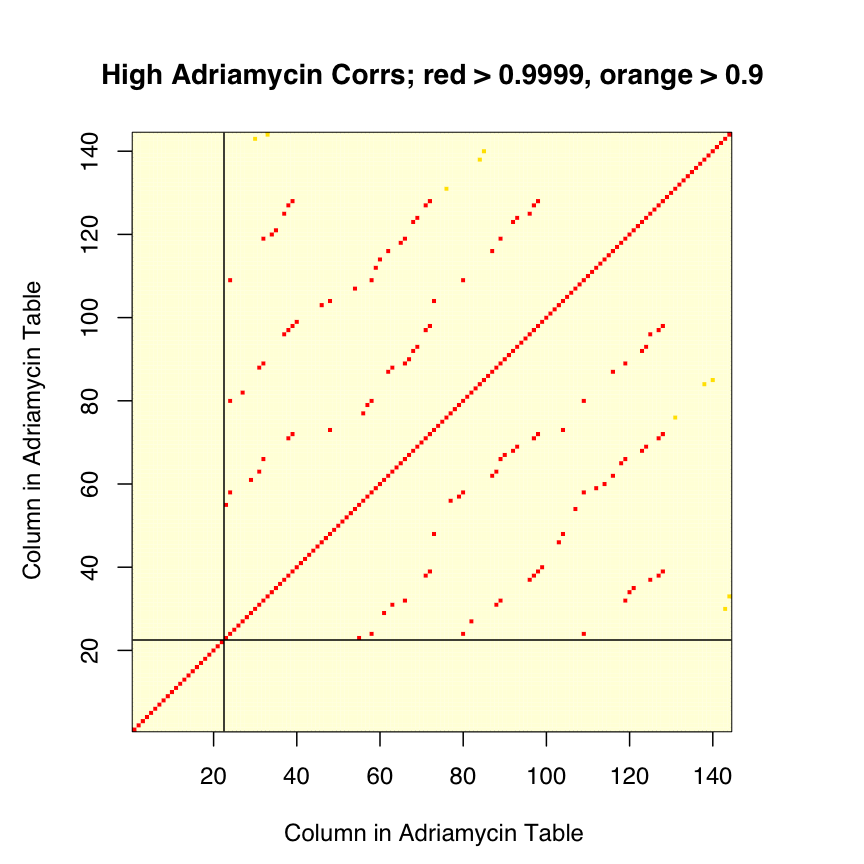
The 122 validation samples are not all distinct; only 84 columns are unique. Some samples are used 2, 3, or 4 times. Further, some of the samples used multiple times are labeled both ways -- one of the samples present 4 times is labeled NR 3 times, and Resp once. Given this "cross labeling", we are hard pressed to see how the labels can be (as asserted) correct, though the counts of 23 Resp and 99 NR do match those shown in Figure 2c of Potti et al.
As with the validation data posted for docetaxel, the validation data posted for adriamycin are wrong.