
xPEDITE
| Overview | |
|---|---|
| Description | Multi-omics (x) PipelinE for Dataset Integration and Translational Exploration (xPEDITE) is a web-based platform to generate interactive HTML data reports |
| Development Information | |
| GitHub | MD-Anderson-Bioinformatics/xPEDITE (opens in new tab) |
| Language | R, JavaScript |
| Platforms | Docker |
| License | GPLv2/MIT |
| References | |
| Citation | Submitted |
| Help and Support | |
| Contact | Mary Rohrdanz |
xPEDITE
The multi-omics (x) PipelinE for Dataset Integration and Translational Exploration (xPEDITE) is a web-based platform designed to streamline data analysis through interactive visualization and statistical modules. xPEDITE generates interactive data visualization reports for various types of input omic data: genomics, transcriptomics, proteomics, metabolomics, lipidomics, and microbiome.
xPEDITE provides a web-based interface for users to upload input data and generate interactive reports. The generated reports are downloadable and do not require any additional software (just web browser). The reports are easily shared among collaborators. See the GitHub README for startup instructions (link in the right sidebar).
Interactive visualizations
All reports include:
- Data distribution plots
- Next-Generation Clustered Heatmaps
- Pathway analysis
Depending on the input data type (e.g. grouped data, time series), additional visualizations are present:
- Principal Components Analysis (PCA)
- Analysis of Variance (ANOVA)
- Volcano plot
- Fold-change bar plot
- Intensity distribution
- Time-series analysis
Example xPEDITE Reports
The following links provide examples of xPEDITE reports.
- Urine Metabolomics Analysis (opens in new tab)
This interactive HTML report provides standardized urine metabolomics analysis comparing metabolic profiles between normal
and prostate cancer (PCa) patient samples for non-invasive biomarker discovery. Key Features:
- PCA-Plus: Visualizes disease-specific metabolic clustering with DSC-based quality assessment across 229 urinary metabolites
- NG-CHM: Reveals cancer-associated metabolic signatures including amino acids, nucleotides, and organic acids
- Volcano Plot: Real-time threshold adjustment for identifying significantly altered metabolites by fold-change and p-value
- Differential Analysis: ANOVA with FDR-adjusted p-values for pairwise disease group comparisons
- Publication-Ready Outputs: High-resolution exportable figures and associated data file for grants and manuscripts
- Multi-Group Report (opens in new tab)
This interactive HTML report provides standardized omics-level data analysis with comprehensive statistical comparison
for multi-group experimental designs. Key Features:
- PCA-Plus: Assesses data quality, outliers, and batch effects via Dispersion Separability Criterion (DSC)
- NG-CHM: Google Maps-style hierarchical clustering heatmaps with seamless zooming
- Differential Analysis: ANOVA with FDR-adjusted p-values across all pairwise comparisons
- Volcano Plot: Real-time threshold adjustment for hit identification by fold-change and p-value
- Pathway Visualization: SBGN-compliant multi-omic data integration
- Publication-Ready Outputs: High-resolution figures and associated data file exportable for grants and manuscripts
- Single Sample Analysis (opens in new tab)
This interactive HTML report provides standardized omics-level data analysis with single-sample fold change ranking
for biomarker discovery in n=1 exploratory or range-finding experiments. Key Features:
- NG-CHM: Hierarchical clustering heatmap for visualizing treatment-induced patterns across single samples per condition
- Fold Change Waterfall Plot: Rank-sorts analytes by log₂ fold-change magnitude for rapid hit identification between any two conditions
- Individual Compound Plots: Bar graphs displaying intensity values across all treatment groups
- Pathway Visualization: SBGN-compliant maps for biological interpretation with customizable color scaling
- Publication-Ready Outputs: High-resolution exportable figures and associated data file for grants and manuscripts
- Time Series Analysis (opens in new tab)
This interactive HTML report provides standardized time series metabolomics analysis for tracking temporal dynamics
across multiple treatment groups and time points (Days 0, 7, 14, 21). Key Features:
- PCA-Plus: Dual visualization for both treatment groups and time points with DSC-based quality assessment
- NG-CHM: Reveals temporal metabolic patterns with group and time covariate bars
- ΔAUC Analysis: Novel deltaAUC metric ranks analytes by effect size and durability using spline-based area calculations (%ΔAUC, propAUC)
- Differential Analysis: Multi-class ANOVA with Group, Time, and Interaction effects; FDR-adjusted pairwise comparisons
- Volcano Plot: Time-point-limited comparisons for precise temporal hit identification
- Publication-Ready Outputs: High-resolution exportable figures and associated data file for grants and manuscripts
- CCLE Breast Cancer (BC) Metabolomics (opens in new tab)
This interactive HTML report provides standardized metabolomics analysis of breast cancer cell lines from the
Cancer Cell Line Encyclopedia (CCLE), enabling subtype-specific biomarker discovery. Key Features:
- PCA-Plus: Visualizes metabolic clustering across BC subtypes (Basal A, Basal B, HER2 Amp, Luminal) with DSC-based quality assessment
- NG-CHM: Reveals subtype-specific metabolic signatures including carnitine metabolism depletion in basal subtypes
- Differential Analysis: ANOVA with FDR-adjusted p-values for all pairwise subtype comparisons
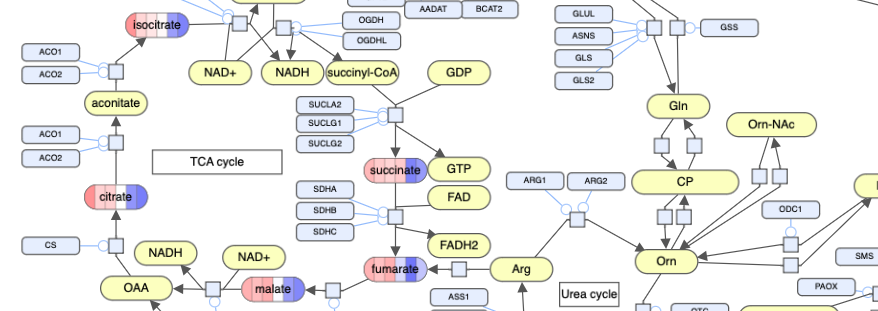
- Pathway Visualization: SBGN-compliant maps highlighting TCA cycle and urea cycle alterations
- Publication-Ready Outputs: High-resolution exportable figures and associated data file for grants and manuscripts
- Transcriptomics Analysis (opens in new tab)
This interactive HTML report provides standardized transcriptomics analysis comparing gene
expression profiles between knockout (CMKLR1_KO) and wild-type (WT) conditions for differential gene
expression discovery. Key Features:
- PCA-Plus: Visualizes genotype-specific expression clustering with DSC-based quality assessment across 1,067 genes
- NG-CHM: Reveals knockout-induced transcriptional signatures with hierarchical clustering of differentially expressed genes
- Volcano Plot: Real-time threshold adjustment for identifying significantly altered genes by log₂ fold-change and p-value
- Differential Analysis: ANOVA with FDR-adjusted p-values for pairwise genotype comparisons
- Publication-Ready Outputs: High-resolution exportable figures and associated data file for grants and manuscripts
- Lipidomics under Gene Knockout Analysis (opens in new tab)
This interactive HTML report provides standardized lipidomics analysis comparing lipid profiles between gene
knockout (CMKLR1_KO) and wild-type (WT) conditions for understanding gene-lipid regulatory relationships. Key Features:
- PCA-Plus: Visualizes genotype-specific lipid clustering with DSC-based quality assessment across knockout and wild-type samples
- NG-CHM: Reveals knockout-induced lipid signatures with hierarchical clustering of differentially abundant lipid species
- Volcano Plot: Real-time threshold adjustment for identifying significantly altered lipids by log₂ fold-change and p-value
- Differential Analysis: ANOVA with FDR-adjusted p-values for pairwise genotype comparisons
- Publication-Ready Outputs: High-resolution exportable figures and associated data file for grants and manuscripts
- Lipidomics Analysis (opens in new tab)
This interactive HTML report provides standardized lipidomics analysis comparing drug response across human
(MDAMB468) and murine (4T1) breast cancer cell models. Key Features:
- PCA-Plus: Visualizes species-specific and treatment-dependent lipid clustering with DSC-based quality assessment
- NG-CHM: Reveals drug-induced lipid signatures including ceramides, phosphatidylcholines, and acylcarnitines across 1,976 lipid species
- Volcano Plot: Real-time threshold adjustment for identifying significantly altered lipids by fold-change and p-value
- Differential Analysis: ANOVA with FDR-adjusted p-values for all pairwise treatment comparisons
- Publication-Ready Outputs: High-resolution exportable figures and associated data file for grants and manuscripts
- Microbiome CRC (opens in new tab)
This interactive HTML report provides standardized microbiome abundance analysis comparing gut microbial communities
across colorectal cancer (CRC) disease states: adenoma, CRC, and healthy controls. Key Features:
- PCA-Plus: Visualizes microbial community clustering across disease groups with DSC-based quality assessment
- NG-CHM: Reveals disease-associated microbial signatures across 347 bacterial taxa including Clostridium, Eubacterium, and Streptococcus species
- Volcano Plot: Real-time threshold adjustment for identifying differentially abundant taxa by fold-change and p-value
- Differential Analysis: ANOVA with FDR-adjusted p-values for all pairwise group comparisons
- Publication-Ready Outputs: High-resolution exportable figures and associated data file for grants and manuscripts
- Oxidized Lipid Analysis (opens in new tab)
This interactive HTML report provides standardized oxidized lipid analysis comparing drug response across human
(MDAMB468) and murine (4T1) breast cancer cell models for lipid peroxidation biomarker discovery. Key Features:
- PCA-Plus: Visualizes species-specific and treatment-dependent oxidized lipid clustering with DSC-based quality assessment
- NG-CHM: Reveals drug-induced oxidative stress signatures across 36 oxidized lipid species including OxPC, OxLPC, and Coenzyme Q10
- Fold Change Analysis: Waterfall plot ranking oxidized lipids by log₂ fold-change for rapid hit identification
- Individual Compound Plots: Violin plots displaying distribution patterns across treatment groups
- Publication-Ready Outputs: High-resolution exportable figures and associated data file for grants and manuscripts
- RPPA Proteomics (opens in new tab)
This interactive HTML report provides standardized RPPA (Reverse Phase Protein Array) proteomics analysis of
TCGA breast cancer patient samples across molecular subtypes (Basal, Her2, LumA, LumB, Normal). Key Features:
- PCA-Plus: Visualizes subtype-specific protein expression clustering with DSC-based quality assessment across 99 patient samples
- NG-CHM: Reveals subtype-associated protein signatures including metabolic (ACSL1, ACC1, FASN), apoptotic (BAX, BCL2, BID), and DNA repair (ATM, ATR, ERCC1) markers
- Volcano Plot: Real-time threshold adjustment for identifying differentially expressed proteins by fold-change and p-value
- Differential Analysis: ANOVA with FDR-adjusted p-values for all pairwise subtype comparisons
- Publication-Ready Outputs: High-resolution exportable figures and associated data file for grants and manuscripts