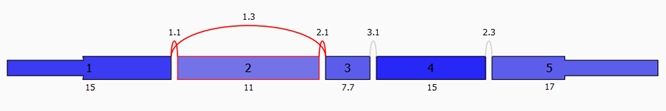
What is SpliceSeq?
SpliceSeq is an analytical tool for RNASeq data with an interactive, visual results viewer. It can be used to explore the transcriptome of a single sample or group of samples and performs comparative analysis to identify significant changes in splicing patterns (splice events). SpliceSeq analysis is based on composite splice graphs of each gene constructed from Ensembl transcripts. RNASeq reads are aligned to unique locations in a splice graph and normalized expression levels are calculated for every exon and splice junction. SpliceSeq also detects and quantifies novel splices. Please see the SpliceSeq methods page for more details.
What is TCGA SpliceSeq?
The TCGA SpliceSeq is an alternative splicing database constructed by applying SpliceSeq's analysis methods to RNASeq samples from The Cancer Genome Atlas project (TCGA). TCGA SpliceSeq provides search and visualization functions for examination of transcript patterns for groups of tumor samples, and identification of splicing pattern differences between tumor types and between tumor and adjacent normal samples.
What types of Splice Events are detected?
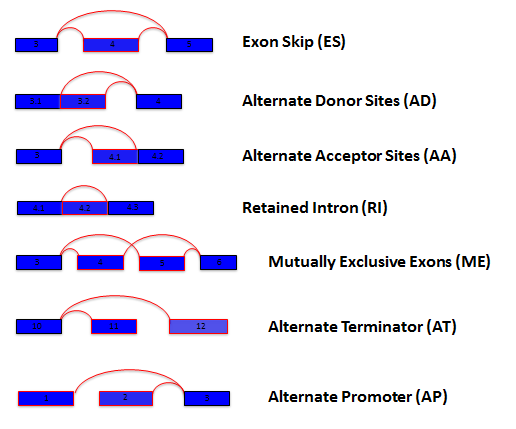
A splice event is a change in splicing patterns between groups of
samples. Seven different types of splice events are detected:
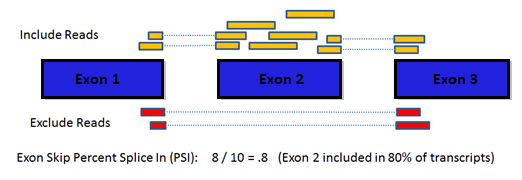
How are Splice Events quantified / What is PSI?
For each sample and every possible splice event (e.g. an exon skip
event), we calculate a percent-splice-in (PSI) value. PSI is the ratio
of normalized read counts indicating inclusion of a transcript element
over the total normalized reads for that event (both inclusion and
exclusion reads). A PSI value of .8 for an exon skip event would
indicate that the exon is included in approximately 80% of the
transcripts in the sample. Changes in average PSI values when
comparing groups of samples indicate a shift in splicing patters
between the groups or a splice event. Examination of scatter plots,
standard deviation ranges, and t-test p-values are used to confirm the
robustness of a splicing event.
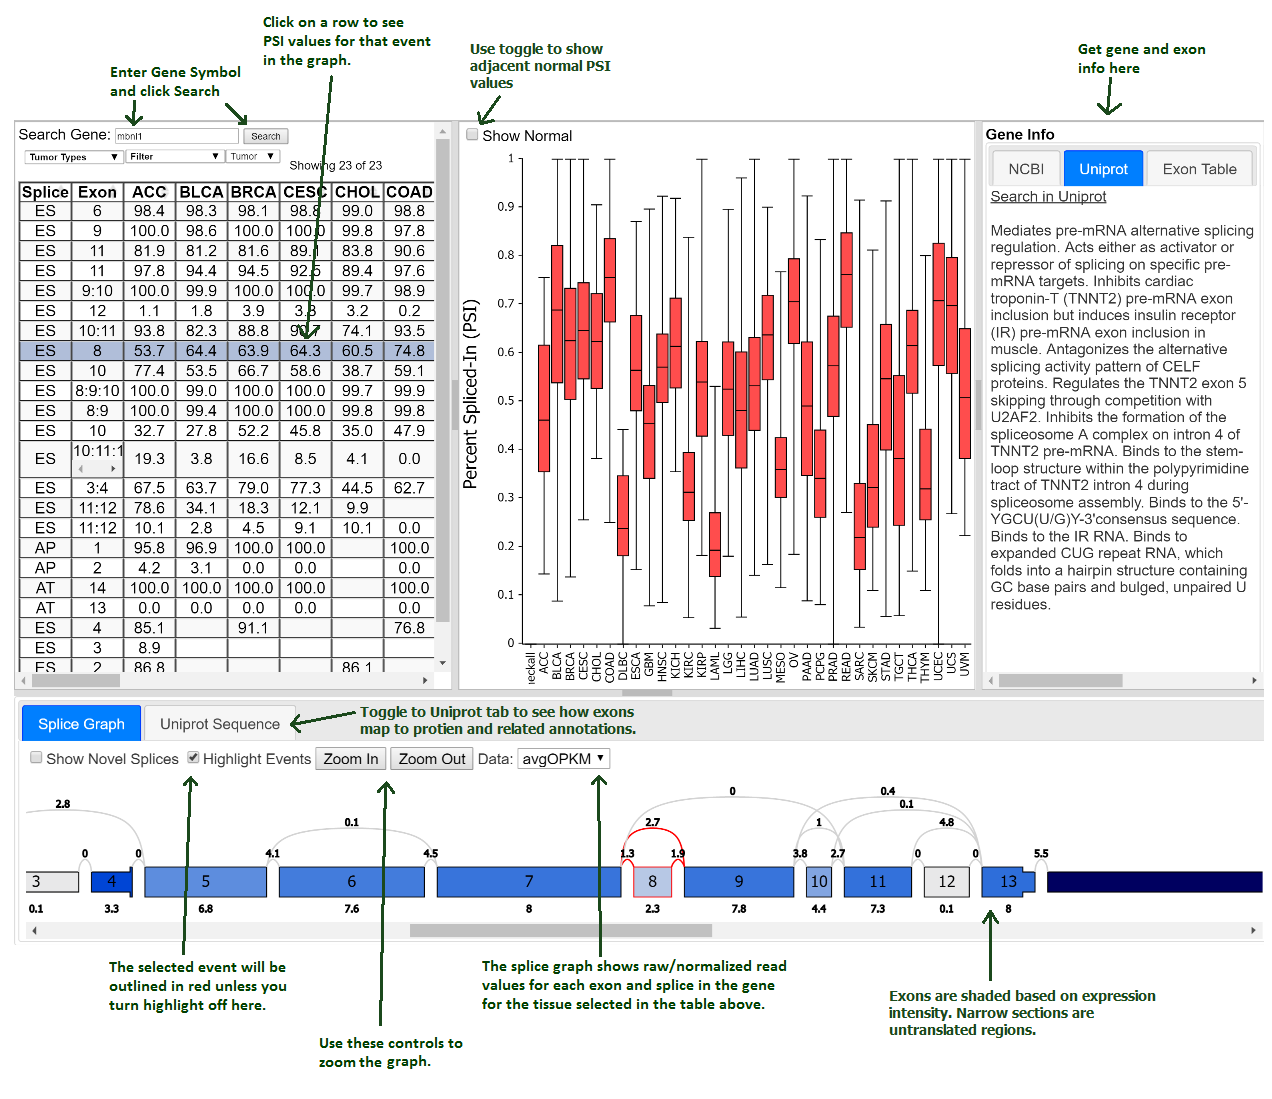
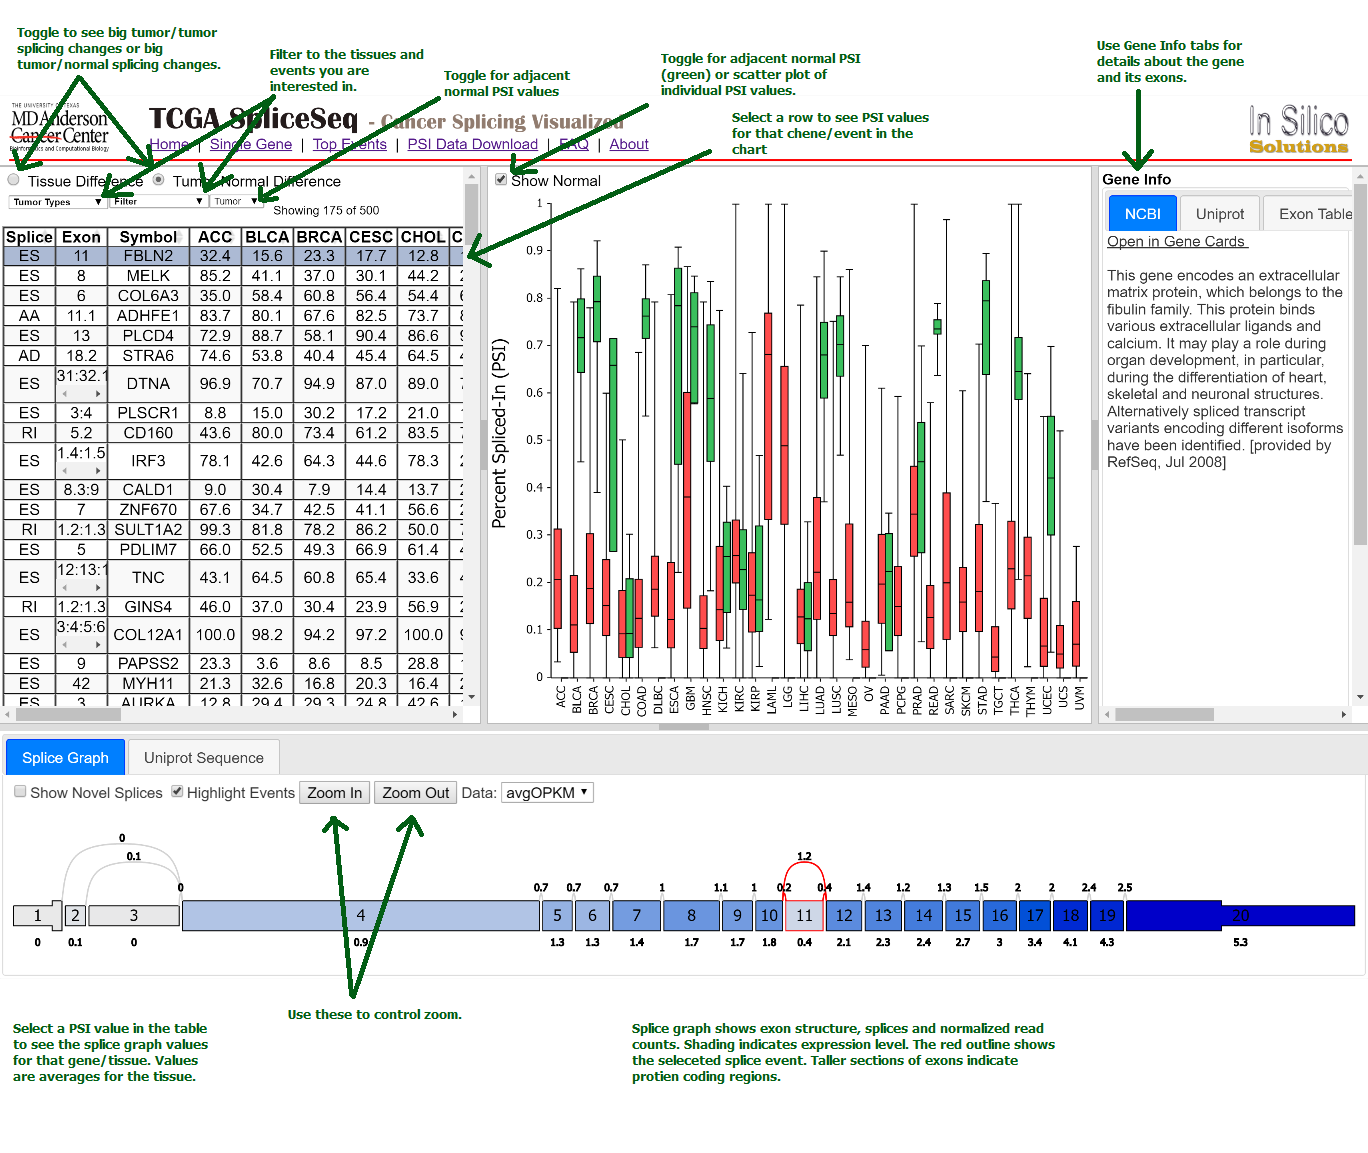
How does the single gene splice events page work?
To examine a gene of interest, follow the path on the home page for a
single gene search or select the Single Gene link in the header bar
menu. The single gene page displays all the potential splice events
for the gene symbol you enter. Click a row in the table to see the
average PSI across tumor types for that splicing event. Select a
specific PSI value in the table to see the splice graph values for a
particular tumor type.
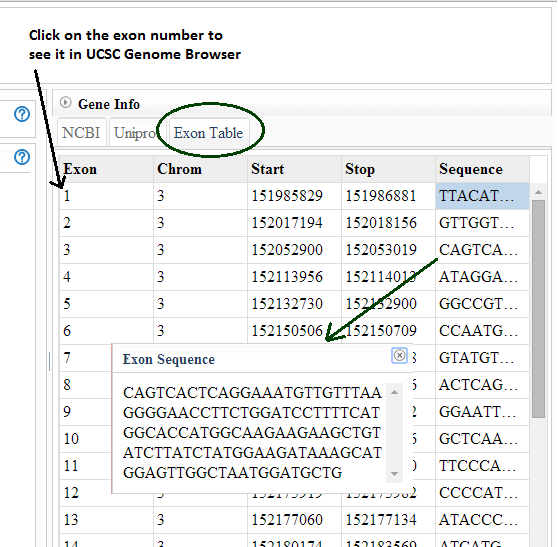
How do I get information about an exon in a splice event to
relate it to other references?
SpliceSeq exon numbers are assigned when we build our splice graphs
and may not relate to exon names in external references. Select the
Exon tab in the Gene Info panel to get a description of the exons
including the hg19 coordinates of the exon. This can be used to match
exons to external exon names. Select the sequence column to copy /
paste exon sequences. If you would like a full reference to the
genomic locations of each gene/exon in our splice graphs, you can
download it here: TCGA_SpliceSeq_Grap_Structure.zip
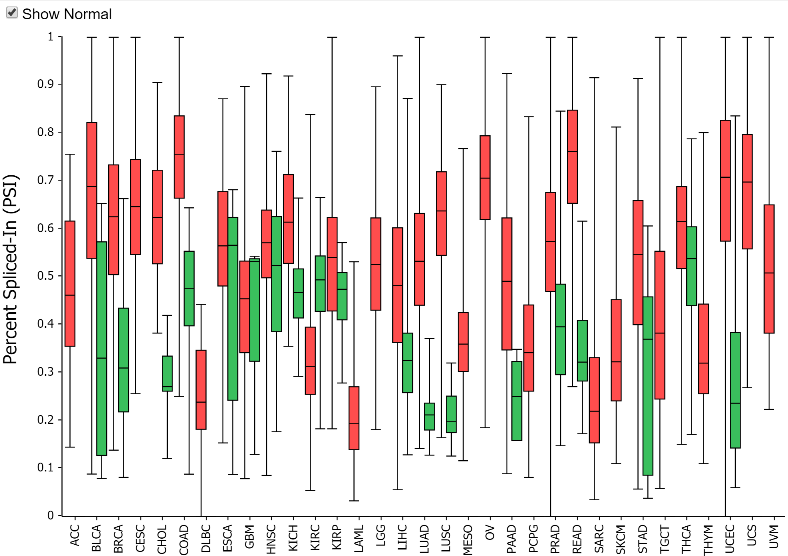
Why include adjacent normal PSI values?
Adjacent normal samples in the TCGA data must be used with caution in
splice event analysis because the adjacent normal samples often are
not well matched in tissue composition to the tumor progenitor cells.
Tissue type differences can certainly obfuscate tumor/normal splicing
analysis. Further, adjacent normal tissue is subject to field effects
from the tumor. Despite these concerns, the adjacent normal values are
presented to give some feel for the range of PSI values for a
particular event in normal tissues. This can show some interesting
patters where despite a wide range of PSI values across tissues, the
tumor PSI values are generally increased from that of their matched
normal tissues. For example, the exon 8 skip event in MBNL1 shows a
fairly dramatic increase in PSI for all tissues with adjacent normal
samples.
Note: the table can be toggled with the Tumor/Normal
drop down to show adjacent normal rather than tumor PSI values.
Toggling to normal and clicking on a cell will also allow you to see
the splice graph values for normal tissue.
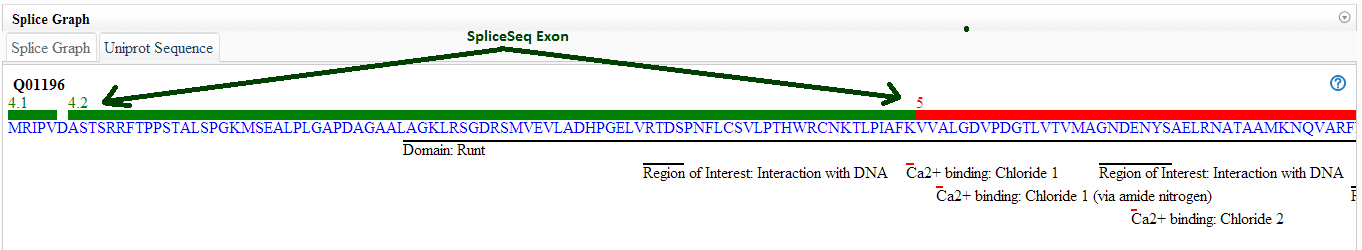
What does the UniProt tab tell me?
The UniProt tab shows how the exons of the splice graph map to the
canonical protein product of the gene. This may be useful in
predicting the impact of a splicing event. In addition to the protein
sequence, the protein tab contains may UniProt annotations to assist
with identification of exons with functional elements. The '?' tooltip
on the UniProt tab displays a color code and list of the UniProt
annotations available.
How and why do I use the Top Events page?
Your genes of interest may not be the genes that show large splicing
variation. An alternate path for splicing investigation is to look
through the list of genes that do show lots of splicing differences
between different tumor types or between tumor and adjacent normal
samples. The Top Events list allows you to select all tumor types or a
subset of tumor types to investigate. It then displays a sorted list
of splicing events. Based on your selection it will be sorted to show
the events with the largest variation across tumor samples or the
largest variation between tumor and normal samples. Scrolling down
through this list while looking at the PSI graph and gene description
panel is a quick way to locate potentially interesting splicing
events.
How and why would I download data on the Gene PSI Data Download
page?
There are many types of data available for TCGA data (methlyation,
gene expression, mutation, copy number, protein expression, etc). The
PSI values that can be downloaded from this page can be used for
integrative analysis in which a researcher wishes to investigate the
relation between other factors and resultant splicing changes. For
example, one could investigate associations between expression levels
of a splicing factor and changes in exon inclusion in a metabolism
gene of interest.
Select a tissue type and gene(s) and
sample(s) to download splice event PSI data. Leave gene(s) and/or
sample(s) blank to get all genes/samples. You can also filter to specific
types of splice events. The returned data is a comma separated file suitable for
bioinformatic analysis or inclusion in a spreadsheet.