This page is an overview of serchable data in the tcga_rppa_lgg_v2.0_sample_sample next-generation clustered heat map. The interactive heat map this page describes can be reached at this link tcga_rppa_lgg_v2.0_sample_sample or on one of the links below such as the Heat Map Name, Map Id, or the thumbnail graphic image or through the The Cancer Genome Atlas (TCGA) 
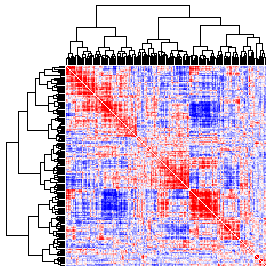
Next-Generation Clustered Heat Map (NG-CHM) Compendium viewer.

Heat Map Description

Sample-sample comparison of RPPA for 193 proteins in 175 tcga LGG samples, using the MD Anderson Standardized TCGA Data (version 2016_01_20_1306) with unexpressed genes removed and up to 2000 most highly variable genes added.

General Information

Heat Map Name: tcga_rppa_lgg_v2.0_sample_sample
Map Id: 78ad6ed5ddedec4eb6cb1fb6aeb10e0b98b76ac3

Tumor Type: Brain Lower Grade Glioma (LGG)

cBioPortal Study Id: [[cbioportal_study_id]]

Build Date:2017-04-11 07:00:14
Map Version Id:1.1.0

Top Layer Summary View

Next-Generation Clustered Heat Map thumbnail image.  Click to go to full-sized next-generation heat map tcga_rppa_lgg_v2.0_sample_sample.

Data Layers

Row Information

Number of Rows:175
Row Type:bio.tcga.barcode.sample.vial.portion.analyte.aliquot

Order Method:Hierarchical
Agglomeration Method:ward.D2
Distance Metric:correlation
Has Dendrogram:Yes
Top Items:No top items

Classification Bars:
No row classification bars

Column Information

Number of Columns:175
Column Type:bio.tcga.barcode.sample.vial.portion.analyte.aliquot

Order Method:Hierarchical
Agglomeration Method:ward.D2
Distance Metric:correlation
Has Dendrogram:Yes
Top Items:No top items

Classification Bars:
No column classification bars

Matrix Data Items

Row Labels:

Column Labels:

Related Pages