Enhancers are a key class of non-coding regulatory DNA regions, and their critical roles in cancer have attracted more and more attention. Recent studies of ours and others have shown that enhancer activities can be inferred from RNA-seq data based on enhancer RNA (eRNA) signals. But quantifying eRNA profiles depend heavily on precise enhancer transcription loci, and currently only a small proportion of eRNA loci has been identified. This knowledge gap significantly limits the investigations of enhancer-mediated cancer mechanisms. Further, ChIP-seq cannot be easily applied to large cohorts of tissue samples such as TCGA, preventing the related clinical investigations and applications.
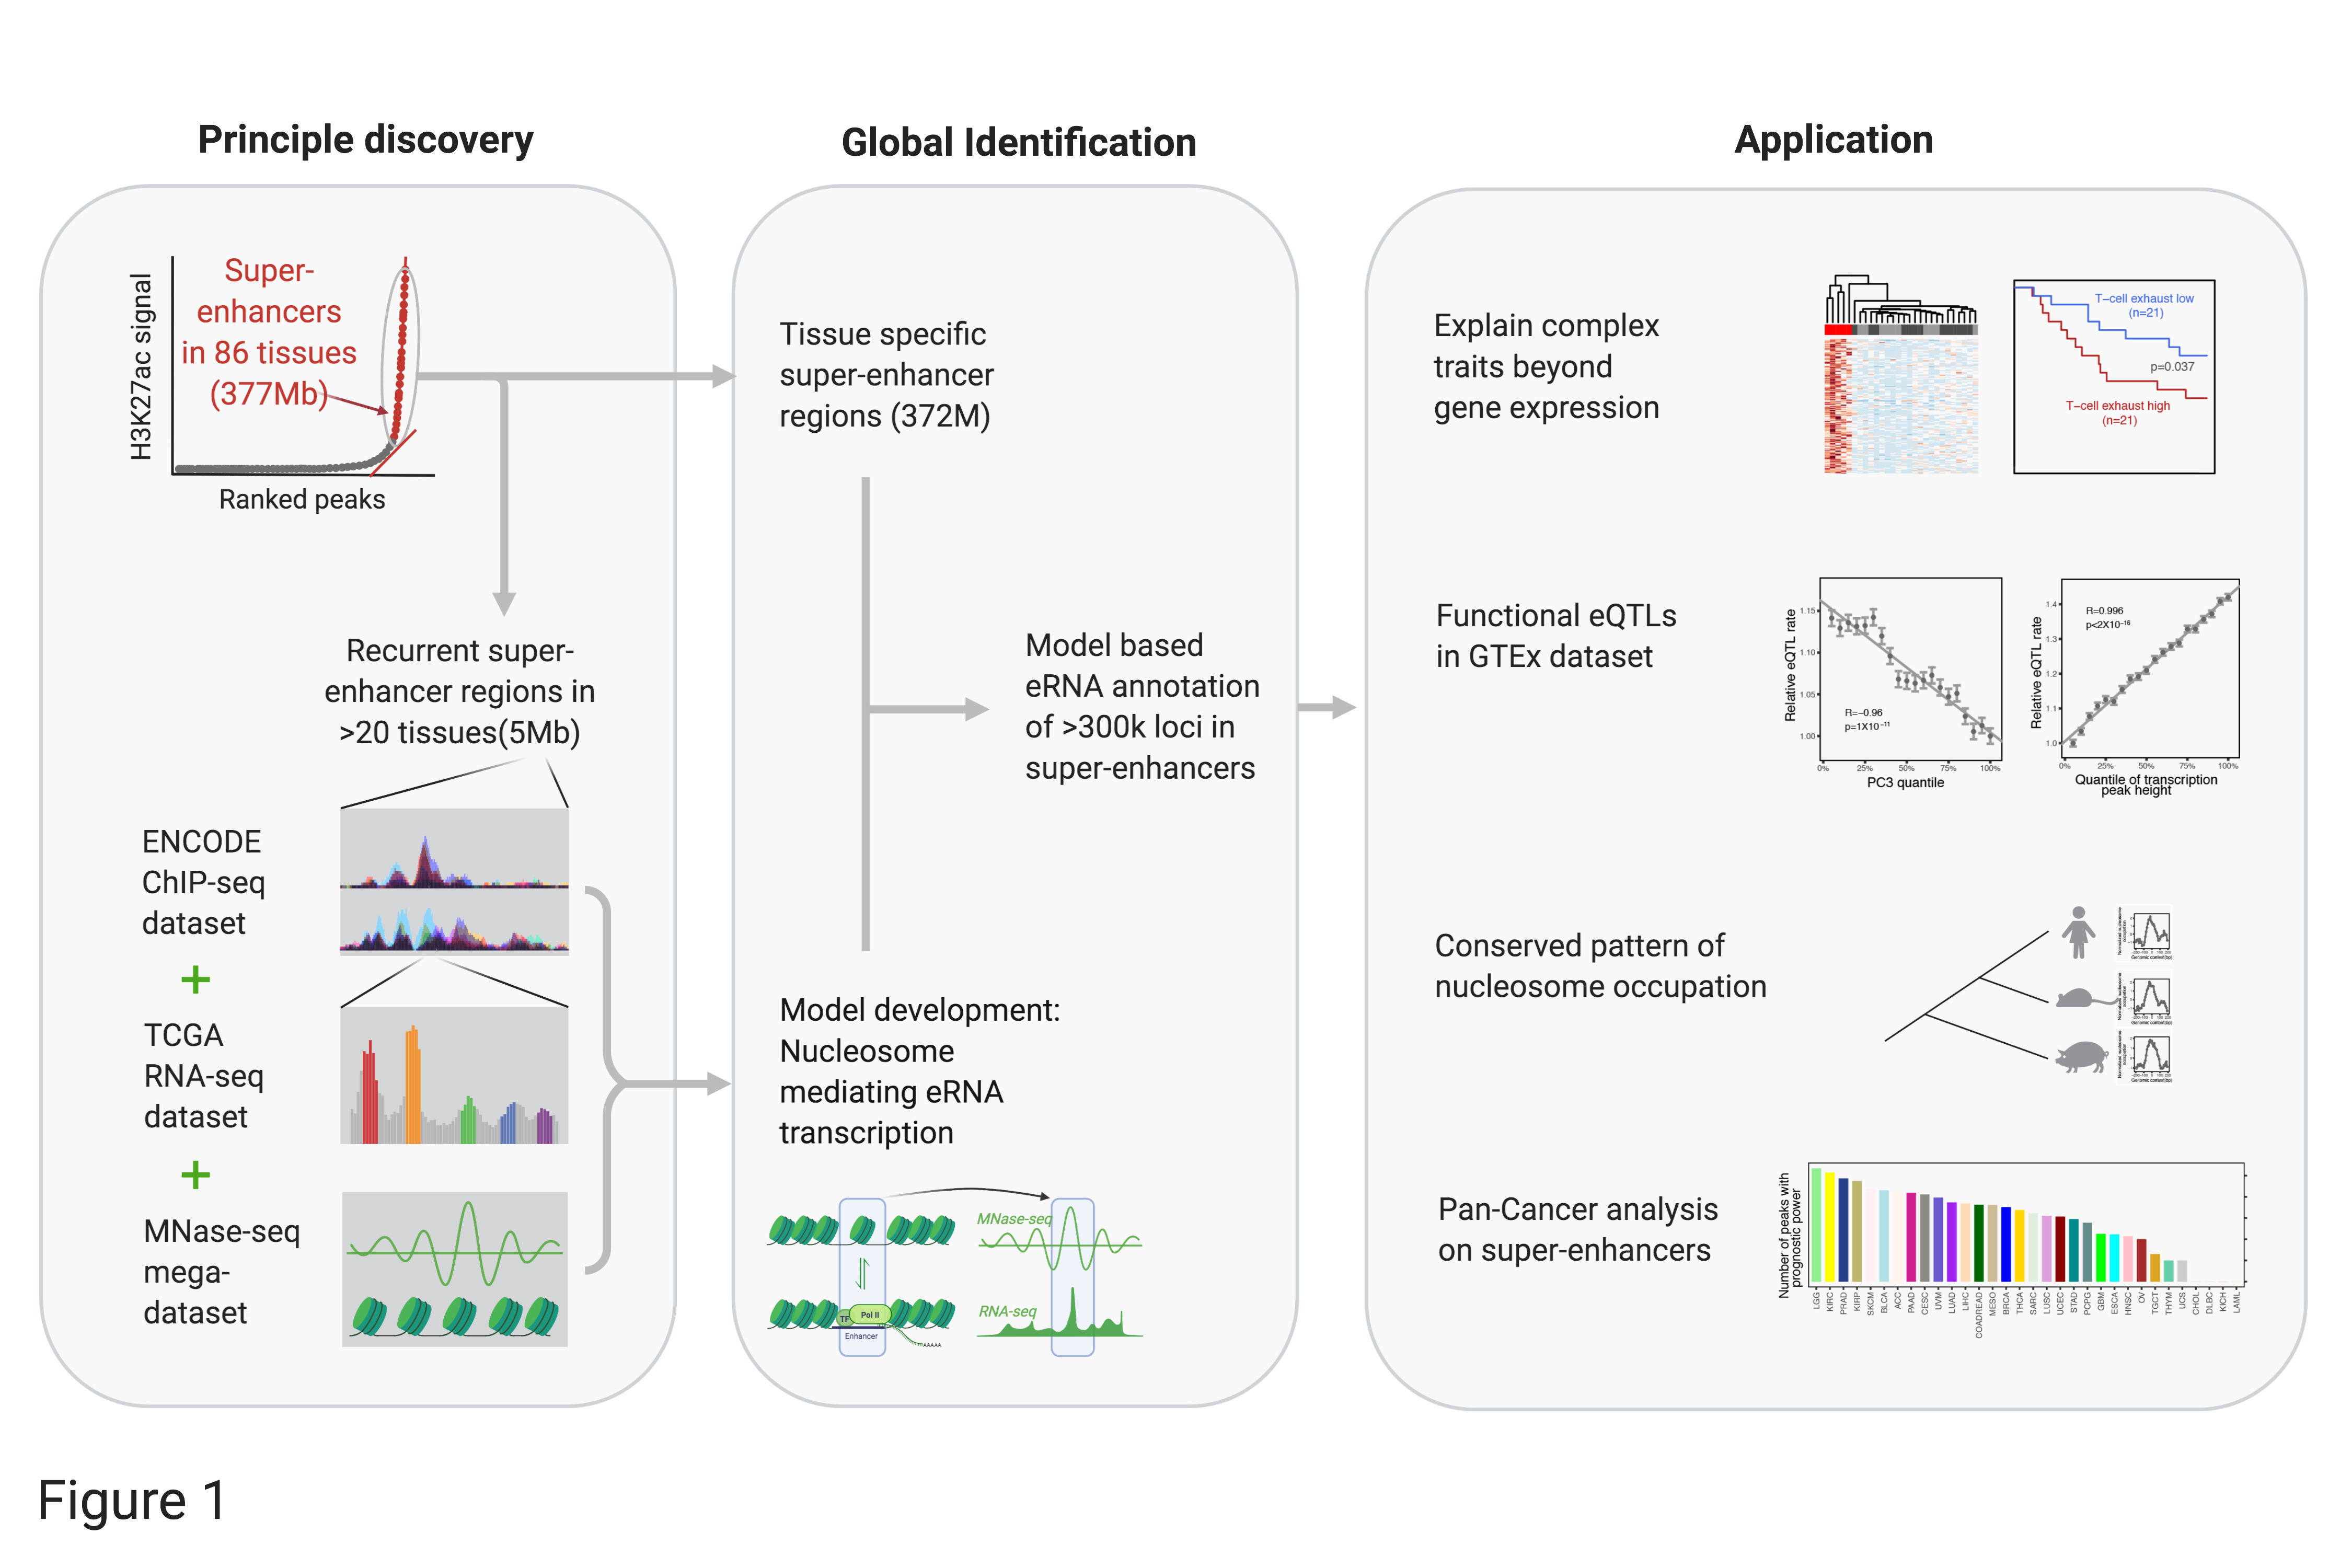
Here we develop the Cancer eRNA Atlas (TCeA) data portal to utilize ultra-deep RNA-seq data aggregated from TCGA and GTEx (~10,000 samples/runs in each set) for the discovery of eRNA epxression patterns in super-enhancers. We found that super-enhancers usually contain discrete loci featured by sharp eRNA expression peaks (~100bp). The locations of eRNA expression peaks are highly recurrent across different tissues, once activated. The expression of super-enhancer eRNA loci are regulated by well-positioned nucleosomes. These well-positioned nucleosomes are not only conserved across different tissues but also across mammalian evolution. Based on these principles, we systematically identified >300,000 such precise eRNA loci in ~377 Mb of super-enhancer regions (and more in the broad putative regulatory regions), providing the very first high-resolution map of eRNA loci in super-enhancers (see our work-flow in Figure 1). With this map, super-enhancer activities can be easily and accurately measured in patient samples using routine RNA-seq, thereby enabling a broad range of biological investigations and translational applications. TCEA portal has provided the annotation of these eRNA loci and quantified their activity in > 20,000 tumor (TCGA), tissue (GTEx), and cell line (CCLE) samples.
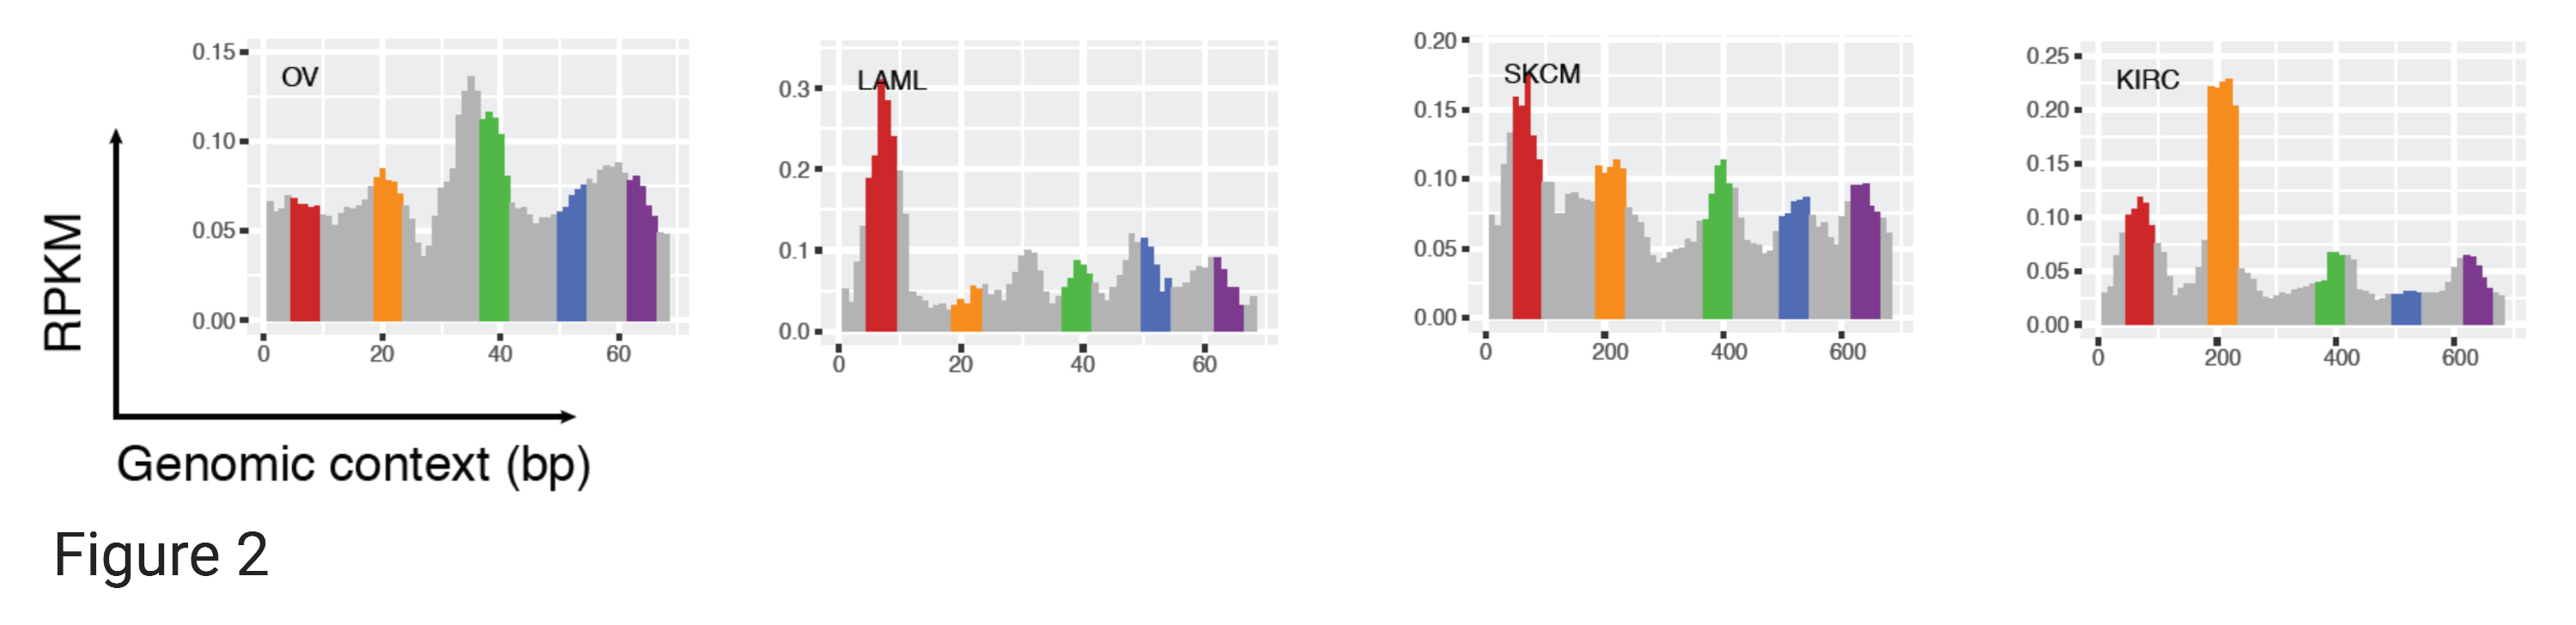
We first focused on a subset of 1,531 (out of ~58,000) core super-enhancers (~5 Mb) that were consistently identified and activated in >20 (out of 86) tissue/cell types (Denes Hnisz et al 2013) for exploratory analysis. we calculated the eRNA expression levels for all tandem 10 bp windows in the 5Mb core super-enhancer set for >10,000 TCGA samples across 32 cancer types. Data of all samples of the same cancer type were pooled together to obtain a deeply aggregated RNA-seq coverage. We noticed highly recurrent sharp eRNA expression peaks across the super-enhancer bodies, as illustrated by a ~670 bp region in Figure 2. In 28 of the 32 cancer types, we observed five sharp eRNA expression peaks with lengths of only a few dozen base-pairs near the 70th, 210th, 390th, 520th, and 640th nucleotide positions (4 cancer types are plotted in Figure 2 for demonstration).
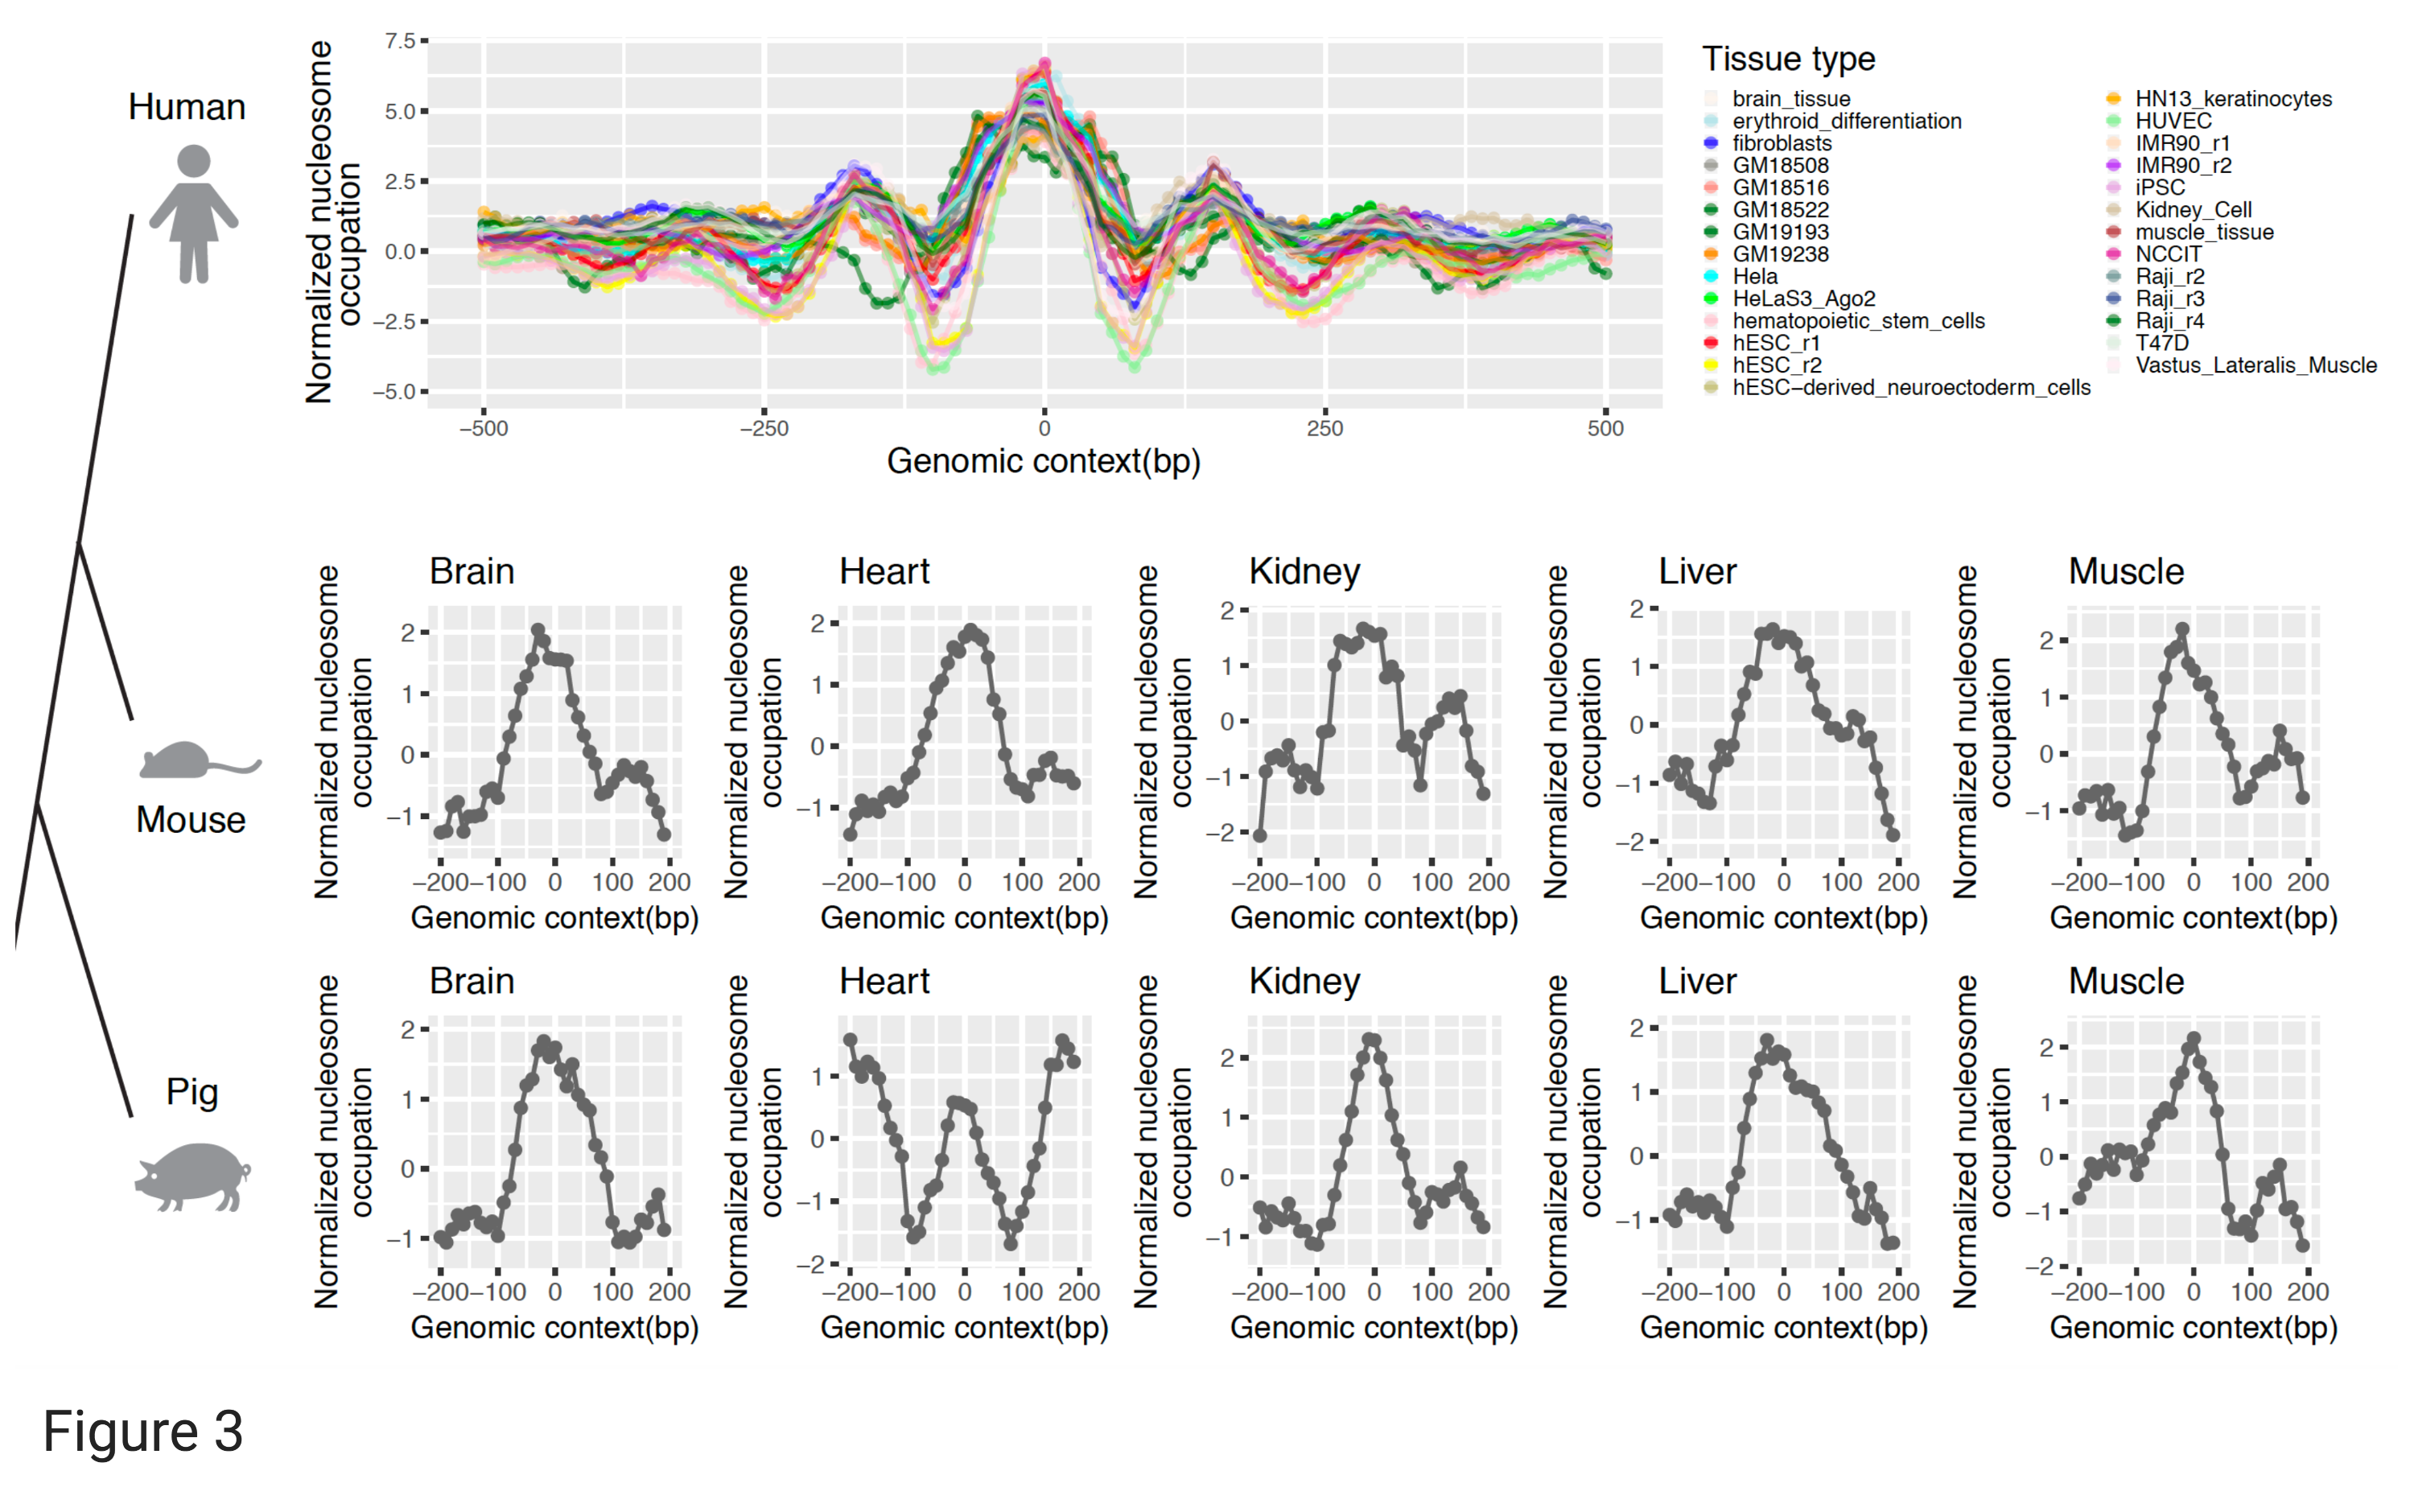
By systematically analyzing ~30k such eRNA peaks in the 1,531 core super-enhancers, we found that their genomic loci are usually occupied by well-positioned nucleosomes across a panel of ~29 MNase-seq profiles and across macro-evolution (Figure 3). These analysis indicates the epigenetic regulation mediated by nucleosome binding on the transcriptional initiation of eRNAs in super-enhancers, similar to that observed for gene transcription start sites (TSS).
In summary, we made two key observations on the eRNA loci in super-enhancers: (i) a super-enhancer usually contains multiple eRNA loci generating short eRNA species <100 bp; and (ii) these eRNA loci tend to coincide with well-positioned nucleosomes. We therefore generalized our analysis to the whole set of super-enhancers (~377 Mb), which would otherwise suffer greatly from the noise of global transcription background without precise enhancer locus annotation. We built a PCA model identifying ~300k eRNA loci meeting the critarium of (1) with short eRNA expression peak and (2) being occupied by well-positioned nucleosomes.
Since the initial systematic annotation of Super-enhancers (Hnisz et al., 2013), more and more H3K27ac profiles in diverse cell/tissue types have been aggregated. To further explore the regulatory genome, we collected a bundle of ~350 H3K27ac profiles from the cistrome (Liu et al., 2011) and SEdb (Jiang et al., 2019) database and annotated an additional ~320Mb putative super-enhancer regions using the ROSE software (Whyte et al., 2013). The PCA model derived in the initial analysis was applied on these putative super-enhancer regions for the discover of another dataset of ~200k eRNA loci. The annotation of these loci can be downloaded here and expression level (RPKM) can be downloaded here. More details about the TCeA analysis can be found in our recent publication.