A pan-cancer proteomic perspective on The Cancer Genome Atlas
Heatmap of RBN pan-cancer dataset based on unsupervised clustering (Interactive and high-resolution heatmap of Figure 2a)
Link - Figure2a
Heatmap of MC pan-cancer dataset based on unsupervised clustering (Interactive and high-resolution heatmap of Figure 3a)
Link - Figure3a
Heatmaps of pathway score based RBN pan-cancer dataset (Interactive and high-resolution heatmaps of Figure 4c-f and Supplementary Figures 6 and 8)
Apoptosis score
Link - Supervised by clusters and score
Link - Supervised by tumor lineages and score
Cell cycle score
Link - Supervised by clusters and score
Link - Supervised by tumor lineages and score
DNA damage response score
Link - Supervised by clusters and score
Link - Supervised by tumor lineages and score
EMT score
Link - Supervised by clusters and score
Link - Supervised by tumor lineages and score
Hormone_a score
Link - Supervised by clusters and score
Link - Supervised by tumor lineages and score
Hormone_b score
Link - Supervised by clusters and score
Link - Supervised by tumor lineages and score
PI3K/Akt score
Link - Supervised by clusters and score
Link - Supervised by tumor lineages and score
Ras/MAPK score
Link - Supervised by clusters and score
Link - Supervised by tumor lineages and score
RTK score
Link - Supervised by clusters and score
Link - Supervised by tumor lineages and score
TSC/mTOR score
Link - Supervised by clusters and score
Link - Supervised by tumor lineages and score
Dotplots of pathway scores based on RBN pan-cancer dataset (Supplementary Figures 7 and 9)
Pathway scores across RBN clusters
Pathway scores across tumor lineages
Heatmaps of actionable proteins based on RBN pan-cancer dataset (Interactive and high-resolution heatmaps of Figure 5)
Link - Supervised by clusters and score
Link - Supervised by tumor lineages and score
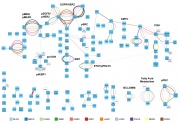
Unbiased data-driven signaling network (High-resolution of Figure 6)

Matched (cis) correlation and fold change analyses
Matched (cis) protein:mRNA correlation analysis (Full result of Supplementary Data 1)
By diseases
Suppl_Data_1_cis_mRNA(BLCA).csv
Suppl_Data_1_cis_mRNA(BRCA).csv
Suppl_Data_1_cis_mRNA(COAD).csv
Suppl_Data_1_cis_mRNA(GBM).csv
Suppl_Data_1_cis_mRNA(HNSC).csv
Suppl_Data_1_cis_mRNA(KIRC).csv
Suppl_Data_1_cis_mRNA(LUAD).csv
Suppl_Data_1_cis_mRNA(LUSC).csv
Suppl_Data_1_cis_mRNA(OVCA).csv
Suppl_Data_1_cis_mRNA(Pan-Cancer).csv
Suppl_Data_1_cis_mRNA(READ).csv
Suppl_Data_1_cis_mRNA(UCEC).csv
Matched (cis) protein:CNV fold change analysis (Full result of Supplementary Data 5)
Matched (cis) protein:mutation fold change analysis (Full result of Supplementary Data 7)
Trans correlation and fold change analyses
Protein:mRNA (trans) correlation analysis (Full result filtered with Spearman’s ρ>0.3 or ρ<-0.3 of Supplementary Data 2)
Protein:miRNA (trans) correlation analysis (Full result of Supplementary Data 3)
Protein:protein (trans) correlation analysis (Full result of Supplementary Data 4)
Suppl_Data_4_trans_protein.csv
Protein:CNV (trans) fold change analysis (Full result filtered with fold change ≤0.8 or ≥1.2 of Supplementary Data 6)
Suppl_Data_6_trans_CNV_amp.csv
Suppl_Data_6_trans_CNV_del.csv
Protein:mutation (trans) fold change analysis (Full result filtered with adj. P<0.05 and mutation case >1% of Supplementary Data 8)
Discriminators analyses (Full results of Supplementary Tables 2-5 and 9-12)
Suppl_Table_2_protein_discriminators_RBN.xls
Suppl_Table_3_RNA_discriminators_RBN.xls
Suppl_Table_4_miRNA_discriminators_RBN.xls
Suppl_Table_5_mutation_discriminators_RBN.xls
Suppl_Table_9_protein_discriminators_MC.xls
Suppl_Table_10_RNA_discriminators_MC.xls
Suppl_Table_11_miRNA_discriminators_MC.xls
Suppl_Table_12_mutation_discriminators_MC.xls
Visualization of the absolute partial correlation of the protein-protein links in the network (High-resolution figure Supplementary Figure 13)