This project is archived and no longer maintained.
Cromwell: Thresholding
| Overview | |
| Description | Graphical tools to aid users in choosing critical parameters for Cromwell spectra denoising |
| Development Information | |
| Language | Matlab |
| Current version | 1.0 |
| Platforms | Platforms supporting Matlab |
| Status | Active |
| Last updated | 12th March 2004 |
| References | |
| Citation | Coombes KR, Tsavachidis S, Morris JS, Baggerly KA, Hung MC, Kuerer HM. (2005). Improved peak detection and quantification of mass spectrometry data acquired from surface-enhanced laser desorption and ionization by denoising spectra with the undecimated discrete wavelet transform. Proteomics, 5(16), 4107-4117. https://doi.org/10.1002/pmic.200401261 |
| Help and Support | |
| Contact | Kevin R. Coombs |
Cromwell: Choosing thresholds for Cromwell
Cromwell is an implementation of our algorithms for low-level processing of mass spectrometry proteomics data. Cromwell uses the undecimated discrete wavelet transform to denoise spectra; a critical parameter is the threshold to use for denoising. We have developed graphical tools to aid users in making this decision.
Packages
The following Matlab .m function files are in the download package:
- sizerPrep.m: This function smooths the raw spectrum intensities and returns the information in the form of a matrix.
- sizerPlot.m: This function produces a graph containing a heatmap of the deviations of the smooth spectra from the “infinitely smoothed” spectrum, along with overlays of the raw spectrum and the smooths corresponding to the minimal and maximal displayed thresholds.
Download
We have provided a readme file and two MATLAB scripts in a zip file.
Installation
Please set the Matlab path to include the directory containing the scripts. You can find instructions on how to do so here .
Documentation
This documentation is included in the readme file of the download package.
This package consists of two MATLAB functions to assist users with choosing the thresholds for wavelet denoising using the Cromwell package.
[1]
function [smoothed, thresholds] = sizerPrep(inten, thresholds, infinity)

This function takes three inputs
     inten = the raw spectrum intensities
     thresholds = a vector of threshold settings to apply (default = 4:100)
     infinity = a really large threshold setting (default = 1000)
The output consists of two objects
    smoothed is a matrix containing the smooth spectra for all thresholds
    thresholds is the vector of thresholds
The outputs can be used as inputs to the corresponding plotting routine,
sizerPlot.

[2]
function sizerPlot(spec, smoothed, thresholds, sml, range)

The inputs of this function are
    spec = the raw intensity spectrum
    smoothed = a matrix of smoothed spectra from sizerPrep
    thresholds = a vector of thresholds from sizerPrep
    sml = a vector of thresholds that should be displayed
    range = a vector of spectrum time points to display

The function returns no outputs. Instead, it produces a graph containing a
heatmap of the deviations of the smooth spectra from the "infinitely
smoothed" spectrum, along with overlays of the raw spectrum and the smooths
corresponding to the minimal and maximal displayed thresholds.
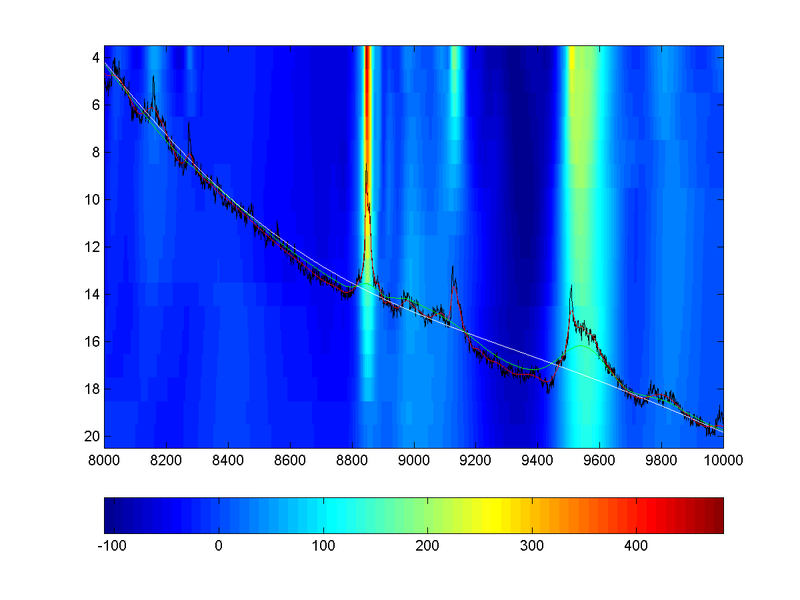
Usage Example
The output of the first script is passed as input to the second, along with display ranges. Atypical output is displayed below. The horizontal axis is the time index in the spectrum; the vertical axis for the heatmap is te threshold. Colors indicate the deviation of the spectrum (at that threshold level) from an “infinitely” smoothed spectrum, represented by the overlaid white curve. The raw spectrum is overlaid in black, along with the smooth curves corresponding to the minimum (in red) and maximum (in green) displayed thresholds
License
Cromwell is copyrighted by the MD Anderson Cancer Center; the licensing details are straightforward, considering that Cromwell is free software from an academic institution.
This is the "cromwell" mass spec analysis package.
Released - <1 March 2004>

CONDITIONS FOR USE:
Copyright (c) 2003, 2004 UT MD Anderson Cancer Center. All rights reserved.

This software is distributed and licensed to you on a non-exclusive
basis, free-of-charge. Redistribution and use in source and binary forms,
with or without modification, are permitted provided that the following
conditions are met:

1. Redistribution of source code must retain the above copyright notice,
   this list of conditions and the following disclaimer.
2. Redistribution in binary form must reproduce the above copyright notice,
   this list of conditions and the following disclaimer in the
   documentation and/or other materials provided with the distribution.
3. All advertising materials mentioning features or use of this software
   must display the following acknowledgment: This product includes
   software developed by the University of Texas MD Anderson Cancer
   Center, Houston, Texas and its contributors.
4. Neither the name of the University nor the names of its contributors
   may be used to endorse or promote products derived from this software
   without specific prior written permission.

THIS SOFTWARE IS PROVIDED BY UNIVERSITY OF TEXAS MD ANDERSON CANCER
CENTER, HOUSTON, TEXAS, AND CONTRIBUTORS AS IS AND ANY EXPRESS OR
IMPLIED WARRANTIES, INCLUDING, BUT NOT LIMITED TO, THE IMPLIED
WARRANTIES OF MERCHANTABILITY AND FITNESS FOR A PARTICULAR PURPOSE ARE
DISCLAIMED. IN NO EVENT SHALL MD ANDERSON OR CONTRIBUTORS BE
LIABLE FOR ANY DIRECT, INDIRECT, INCIDENTAL, SPECIAL, EXEMPLARY, OR
CONSEQUENTIAL DAMAGES (INCLUDING, BUT NOT LIMITED TO, PROCUREMENT OF
SUBSTITUTE GOODS OR SERVICES; LOSS OF USE, DATA, OR PROFITS; OR
BUSINESS INTERRUPTIONS) HOWEVER CAUSED AND ON ANY THEORY OF LIABILITY,
WHETHER IN CONTRACT, STRICT LIABILITY, OR TORT (INCLUDING NEGLIGENCE
OR OTHERWISE), PRODUCT LIABILITY, OR OTHERWISE ARISING IN ANY WAY OUT
OF THE USE OF THIS SOFTWARE, EVEN IF ADVISED OF THE POSSIBILITY OF
SUCH DAMAGE.