This project is archived and no longer maintained.
PerfectMatch
| Overview | |
| Description | The program analyzes oligonucleotides produced by Affymetrix Inc. It computes gene expression levels from files using Li Zhang’s Positional Dependent Nearest Neighbor (PDNN) model. |
| Development Information | |
| Current version | 2.3.3 |
| Platforms | Windows |
| Status | Inactive |
| Last updated | 2005-04-04 |
| News | New! The parameter files had been updated to the latest version from Affymetrix , please download and using the new files for perfectmatch program. |
| References | |
| Citation | Zhang L, Miles MF, Aldape KD. A model of molecular interactions on short oligonucleotide microarrays. Nature Biotechnology 21(7), 818-821, 2003 http://dx.doi.org/10.1038/nbt836 |
PerfectMatch
PerfectMatch program is designed to use PDNN model for analyzing Affymetrix microarray data. This model assumes two modes of binding on the oligonucleotide arrays: gene specific binding and non-specific binding (cross hybridization). For each probe, the model gives an estimate of two binding energies, one for gene specific binding, and the other for nonspecific binding. Probe binding energy is computed as a weighted sum of stacking energies of nearest-neighbor nucleotides, where the weights depend on the position along the probe. Using the affinity values, the model then estimates gene expression levels through matching the observed probe signals and model-fitted values. For more details of the method, see the manuscript published by Li Zhang et al. on Nature Biotechnology, 2003 Jul; 21(7): 818-21. The manuscript is also included in the PerfectMtach package.
Download
PerfectMatch Package
Sequence and Parameter files
Human
Murine
Mouse
Probe Binding Energy Calculator
Download the Probe Binding Energy Calculator here. This program can compute probe binding energy for any given probe sequences using PDNN parameters. This program is created for evaluating probe performance to assist probe design.
Installation
Download the new update for PerfectMatch package (updated on 04-04-2005; v2.3.3). Then unzip the files and run the setup program. The program is developed on PC Windows operating system. It does not require user to restart the computer after installation.
You will also need a set of sequence and parameter files to run the program. Please choose the array type and download the files.
After download these files, you need to unzip them and use it in the PerfectMatch program.
Documentation
Please note that detailed documentation can also be found in the program itself in
Menu > Help > Help Topics
General Usage Information
The program has six tabs as the following:
- Normalization
- Optimize parameters
- Estimate gene expression
- View genes
- View CEL image
- Scatter plot
Before using the program, user should first collect all microarray data (CEL files) to be analyzed in a single directory. Besides microarray data, the program also needs additional files to run. These files are probe sequence file, energy parameter file and gene annotation file, which can be downloaded from http://odin.mdacc.tmc.edu/~zhangli/PerfectMatch. Please choose a specific array type as the files are packaged according to array types.
To use the program, user should always start from the Normalization tab to normalize the CEL files. This is a prerequisite to running other tabs. The program uses a quantile normalization procedure that uses only the PM signals with specified probe sequences in the probe sequence file. User must choose a standard CEL file for the procedure. This standard file can either a pre-existing CEL file or a CEL file to be created by the program through averaging all of the CEL files in the CEL file directory.
User should then proceed to optimize the energy parameters for the chosen standard CEL file. After that, user can choose to use the Estimate expression tab or view CEL tabs. To use the View genes tab or Scatter plots tab, the prerequisite condition is to have finished estimation of gene expression. Because the program keeps a copy of specified input files in the registry, user does not need to re-enter input information. Thus, if expression values have been obtained from a set of CEL files, user can choose to use View genes tab without starting from normalization every time.
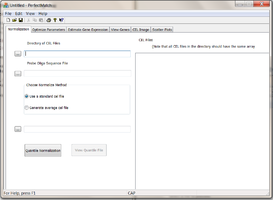
Using the Normalization tab to normalize data
Specifying input files

Click on Directory of Cel Files (1) browser to specify a directory that contain all the *.CEL files to be processed. Note that the program expect that all the CEL files in the directory have the same array type. All the CEL files under the directory will be shown on the left panel under “CEL Files” (7).
Click on Probe Oligo Sequence File browser (2) to specify a file containing the probe sequence information of the array. The file can be obtained from Affymetrix website download center. Be sure to obtain the file in tabular format. You can also download it from our website http://odin.mdacc.tmc.edu/~zhangli/PerfectMatch/
Choose Normalization Method (3): click one of the 2 radio buttons to choose normalization method. The procedure will perform a quantile normalization using only the PM signals with specified probe sequences. User must choose a standard CEL file for the procedure. The normalization process will change PM probe signals with out changing the relative ranks in CEL. After normalization, the adjusted PM probe signal intensity distribution will be identical to that of the stardard CEL file. This standard CEL file can choose either a pre-existing CEL file or a CEL file to be created by the program through averaging all of the CEL files in the CEL file directory.
- Use a standard Cel file: With this option, user can choose a preexisting CEL file. The CEL file must of the same array type as the others.
- Generate average Cel file: With this option, user can specify the standard CEL file name to created. The CEL file will be produced by averaging PM signals of the same ranks for all of the arrays in the CEL file directory.
After verifying all the input fields values are correct, user may click on Quantile Normalization(5) button to begin normalization. After normalization, the View Quantile File(6) button will be enabled. The Quantile file records the distrubtion of PM intensities. It reports probe signals at 2, 25, 25, 50, 75, and 95 percentile for each CEL file. Unusual distributions underlie significant errors in microarray data.
During execution, the status bar displays the progress.
Using the Optimize Parameter tab to optimize energy parameters
Optimize parameters tab is designed for optimizing the probe binding energy parameters for a particular CEL file using PDNN model. It is recommended that user should use this procedure to obtain the optimized energy parameters for the standard CEL file chosen for quantile normalization.
Specifying input files

- Click on Cel File (1) browser to specify a CEL file to be processed.
- Click on Starting Energy parameter File browser (2) to specify a probe binding energy parameter file. This file can be downloaded from our website at http://odin.mdacc.tmc.edu/ ~zhangli/PerfectMatch. Besure sure to choose a correct array type. Although the program allows user to use any starting values, it may take much longer for the program to converge to optimal values when starting from values far from optimal.
- Click on Probe Oligo Sequence File browser (3) to specify a file containing the probe sequence information of the array. The file can also be obtained from our website or Affymetrix website download center. Be sure to obtain the file in tabular format.
- Click on Optimize Parameter File browser (4) to store optimized parameters.
After verifying all the inputs click Start Optimization to begin optimization. Note that the optimization procedure may take a few hours to converge. But user can choose to terminate early if the fitness level shows little progress (check the status bar). The program updates the optimized file every 100 Monte Carlo cycles. Therefore, terminating the program early will not lose the file.
Using the Estimate Gene Expression tab to specify input files and estimate gene expression
This tab is designed to specify input files and compute gene expression values for multiple samples stored in CEL file directory.
Specifying input files

- Click on Directory of Cel Files (1) browser to specify a directory that contain all the *.CEL files to be processed. Note that all the CEL files in the directory must have the same array type. The CEL names are shown in the left panel under “CEL Files”(9).
- Click on Probe Oligo Sequence File browser (2) to specify a file containing the probe sequence information of the array. The file can be obtained from Affymetrix website download center. Be sure to obtain the file in tabular format.
- Click on Probe Binding Energy parameter File browser (3) to specify a probe binding energy parameter file. Examples of such files can be found in the “data” directory included in this package. The parameter file needs to be optimized for the standard CEL file for best results. Please see directions under “ Optimize Parameters” tab for how to perform this task.
- Click on Gene Annotation browser (4) to specify a file containing functional annotation of the probesets in the array. Examples of such files can be obtained from our website or Affymetrix website. Please sure to convert the Affymetrix annotation file in tab-delimited format. This file is optional. Annotation will be included in the output file when specified.
- Click on Gene Expression Output File browser (5) to specify a file to store output.
After specifying the input files, user can click “Estimate Gene Expression” button (8).

A message box will popup to let user decide whether to use full probesets as part of the probesets. Click continue to use the default choice, which uses full probesets. Otherwise, check the Use partial probeset and specify the range of probe index to use and then click on continue.

The “status bar” at the bottom will show the Calculation progress. For each CEL file, four steps will be shown in the status bar: reading CEL file, normalizing data, estimating expression and updating summary output file.
After calculation is finished, status bar will show “Calculation complete” and user can click \“View Output\“(7) or “View Log\“(6) buttons to inspect the output and log files.
Description of the output files
The output file produced by the program is a tab-delimited spreadsheet file, with each row representing a probeset (gene) and each column representing a sample. It contains expression levels of all arrays in the CEL file directory. The expression values are represented on the natural logarithm scale. The gene annotations are listed along with the expression levels. Besides this spreadsheet file, the program also automatically generates a log file “PDNN.log” and a *.pdn files for each associated CEL file. Below is fraction of an example *.pdn file:
| File_ID | Probeset | lnN0 | lnN-C1.CEL | err_T | corr | P_size | crossPM | avg_Affynity |
|---|---|---|---|---|---|---|---|---|
| C1.CEL | 1007_s_at | 12.3 | 12.288 | 0.701 | 0.9941 | 16 | 0.112 | 0.0043 |
| C1.CEL | 1053_at | 12.5 | 12.454 | 0.83 | 0.9886 | 15 | 0.169 | 0.0014 |
| C1.CEL | 117_at | 11.6 | 11.559 | 0.554 | 0.9943 | 14 | 0.245 | 0.0019 |
| C1.CEL | 121_at | 11.3 | 11.342 | 0.307 | 0.9988 | 15 | 0.376 | 0.0054 |
| C1.CEL | 1255_g_at | 11.5 | 11.48 | 0.806 | 0.9867 | 16 | 0.048 | 0.0017 |
| C1.CEL | 1294_at | 11.3 | 11.314 | 0.453 | 0.9963 | 15 | 0.233 | 0.0028 |
| C1.CEL | 1316_at | 11.9 | 11.866 | 0.574 | 0.9944 | 16 | 0.058 | 0.0033 |
Note
These columns provide information for evaluating probe performance. Note that it is the third column that is used for gene expression profiling. File_ID is the CEL file associated with this .pdn file; Probeset is the probeset (gene) name; LnN0 is gene expression level on natural log scale before excluding outliers (this column can be ignored); LnN is gene expression level on natural log scale; err_T defines goodness of fit between the model and the observed data of the probeset; corr is correlation coefficient between the observed and model fitted lnPM signals; P_size is the number of probes used in the model fitting; cross_PM is the estimated ratio of non-specific binding signal vs. total probe signal; avg_affynity is average gene specific binding affinity of the probes in a probeset.
PDNN.log file records information for quality controls purposes. Below is an example Log file:
| Summary | Num genes | Cross-hyb const | Background | Fitness | Absent genes | Scaling Factor |
|---|---|---|---|---|---|---|
| C1.CEL | 22283 | 5114.7 | 192.671 | 1.303 | 0 | 1 |
Note
“ScalingFactor” and “Absent genes” are not properly computed in the current release. Please ignore the values.
Using the View Genes tab to inspect probe level data
This tab is designed to show detailed probe level data along with the model fitted probe signals. User needs to check if Probe Oligo Sequence File and Energy parameter File are correctly specified on “Estimate Gene Expression” tab.
To select or change a gene to be shown, user can select a probeset (gene) from the genes list(1) in the left panel. Probe level data of the chosen probeset in the will be shown in right panel. To change sample, select a CEL file from the CEL file drop down list (2), program will display the predicted data (using PDNN) and the observe data in the display window. MM probe data can be hidden when “Hide MM signal” check box (3) is checked.
Saving data and images

Clicking “Save Image” (4) button will save the graphical image of probe level data in a PNG formatted file. The file name is automatically generated by concatenating the CEL file name and the probeset name. The numerical data shown in the figure can be saved in a text-delimited file when “Save Data”(5) button is clicked. The file name is generated same as the image file but with “TXT” suffix. Clicking “Batch save”(6) button saves the numerical data in all the samples in Cel file list for the same probeset.
Link to information of gene functional information and probeset design.
Clicking “Link to gene and probe seq info” (7) button opens a new browser and direct user to Affymetrix website. The Affymetrix web site provides detailed probe design information as well as functional annotation of the gene. User needs to register on the website to get a login name and password. PerfectMatch program only asks the user to specify user login name and password once.
Using the Cel Image tab to inspect array images
“Cell Image” Tab interface is designed to show observed microarray data and compare with the model fitted probe signals. Please note there are four fields in this window: Display Mode, Zoom Scale, Image files, and a demo window for displaying graphics.

User has two modes to choose from: “Show ln(Signal)” and “Show residue ln(Signal/fitted)”. User can click on a CEL file name (3) to choose a specific sample to view. The image can be scaled (2).
With the first option, “Show ln(Signal)”, the image will display the probe signals on log-scale. The maximum (actually only the 98 percentile) PM probe signal is shown in red, the minimum (actually just the 2 percentile ) probe signal in green, the median as white. Probe signals with in-between values are shown by interpolation. Note that all MM probe signals are ignored.
With the second option,”Show residue ln(Signal/fitted)”, the image will display the log-ratios between the PM probe signals and the model fitted probe signals. An example is shown in below. Similarly, probe signals at 98 percentile shown in red, 50 percentile shown in white, and 2 percentile in green. Other in-between values are shown by interpolation. There are two additional colors, black and blue, which represent the invalid and outliers, respectively.

Residue plot

Using the Scatter Plots tab to generate scatter plots
The “Scatter Plots” Tab are designed to automatically generate scatter plots to compare gene expression values in multiple samples. The program will generate plots for all possible comparisons. User needs to specify the “Gene Expression Output file“and click “Build Plot” button to generate the plots.

Once the plots are generated, user can select one from the list shown in the left panel to see a plot. The plots are generated in PNG format and stored in the Cel file directory. The off-diagonal points are shown in red, which approximately presents the genes with more than two-fold change in gene expression.
Release History
Date: 2004-03-12
Version 2.2 released. The size of window frame can now be adjusted. Some bugs fixed.
Date: 2004-11-11
- Interface lay out changed for clarity.
- Normalization tab was created so that normalization is independent step.
- Bug fixed in Estimate gene expression tab. The problem was that the directory of the output file is sometimes messed up. It seemed that the default the place to store the output file was the directory of the PerfectMatch program, not where the cel files were. This is fixed now.
- Problem: PerfectMtach overwites existing files without warning the users. The output file/ energy file / log file normalization file etc. This is now changed.
- Bug: PDNN.log not openable in Estimate gene expression tab. User sometimes got the error message saying that the PDNN.log file is not openable. Now it is fixed.
- Bug: Normalization tab. When the standard CEL file is not specified correctly and user clicks the “Quantile normalization”, it will continue without any error messages. It is now fixed.
- Add a new feature to report probe signal distribution. A RecordQuantile function has been added in CELFile Class. The function records ranks of 2% 25% 50% 75% 98% of PM signals data. The output file is percentile located in CEL file directory.
- Bug with filenames. The problem was that when ther CEL file names contain white spaces, the output file of gene expression would contain erros. This problem is now fixed.
- The program can use Affymetrix binary CEL format.
Known bugs
- The program slows down when computing hundreds of samples. The problem rises because every time when another sample is completed, the output file will be deleted and a new one is re-written. This can be slow when the file to be deleted is large. Sometimes the program run into problems because the old file can not be deleted in time.
- Incomplete CEL files If the CEL files are incomplete, the program can crash without warning.
- Array type. The program does not verify that the array type is correct. User is assumed to be responsible to match the probe sequence file with the CEL data. If wrong array type is specified, the model fitted probe signals will not fit the observed probe signals, which can be visible in gene view tab.
Reference
Note that the PDF file on this website is slightly different from the one published on Nature Biotechnology journal that contained a few mistakes in the figure legends.