CPPA

| Overview | |
| Description | A comprehensive resource for accessing, visualizing, and analyzing cancer perturbed proteomics. |
| Development Information | |
| URL | https://tcpaportal.org/cppa/ |
| Language | JavaScript (with some R data processing) |
| Current version | 1.6.2 |
| License | Not required for academic use |
| Status | Active |
| Last updated | 2025-07-30 |
| News | version 1.6.2 released. |
| References | |
| Citation | An Atlas of Perturbed Functional Proteomics Profiles of Cancer Cell Lines, under review |
| Help and Support | |
| Contact | Han Liang |
Cancer Perturbed Proteomics Atlas
Please click this link to enter the official CPPA site .
Functional proteomics represents a powerful approach to rapidly improve our understanding the pathophysiology and therapy of cancer. To facilitate access of the broader research community to cancer perturbed proteomics datasets, we have developed a user-friendly data portal, CPPA (Cancer Perturbed Proteomics Atlas). CPPA currently provides five modules: Summary, My Protein, Download, Visualization, and Analysis. Importantly, this resource provides a unique opportunity to identify model cell lines for functional investigation.
Browser Requirements
We recommend use of HTML5-compliant browsers such as Safari, Chrome and Firefox; depending on the version, the performance of IE might not be optimized. Javascript must be enabled by the browser.
How to Use CPPA
The CPPA data portal provides four interactive modules: “Data Summary”, “My Protein”, “Connectvity Map”, and “Analysis”.
Data Summary
This module provides detailed information about each perturbation cell line set, which shows the number of samples for each cel line - compounds pair. Here is an example:
| Set | Cell line UniqName | Compounds | #Total samples |
|---|---|---|---|
| set66 | MCF7 | TRAMETINIB | 83 |
| set38 | MCF7 | LAPATINIB | 84 |
| set43 | MDAMB231 | VOXTALISIB | 24 |
My Protein
My protein module provides annotation of RPPA protein markers, including the corresponding genes and antibody information.
| Protein | Genes | Status | Origin | Source | Catolog Number |
|---|---|---|---|---|---|
| 14-3-3-beta | YWHAB | Validated as ELISA | Rabbit | Santa Cruz | sc-628 |
| 14-3-3-zeta | YWHAZ | Validated as ELISA | Rabbit | Santa Cruz | sc-1019 |
| 4E-BP1 | EIF4EBP1 | Validated as ELISA | Rabbit | CST | 9452 |
Connectivity Map
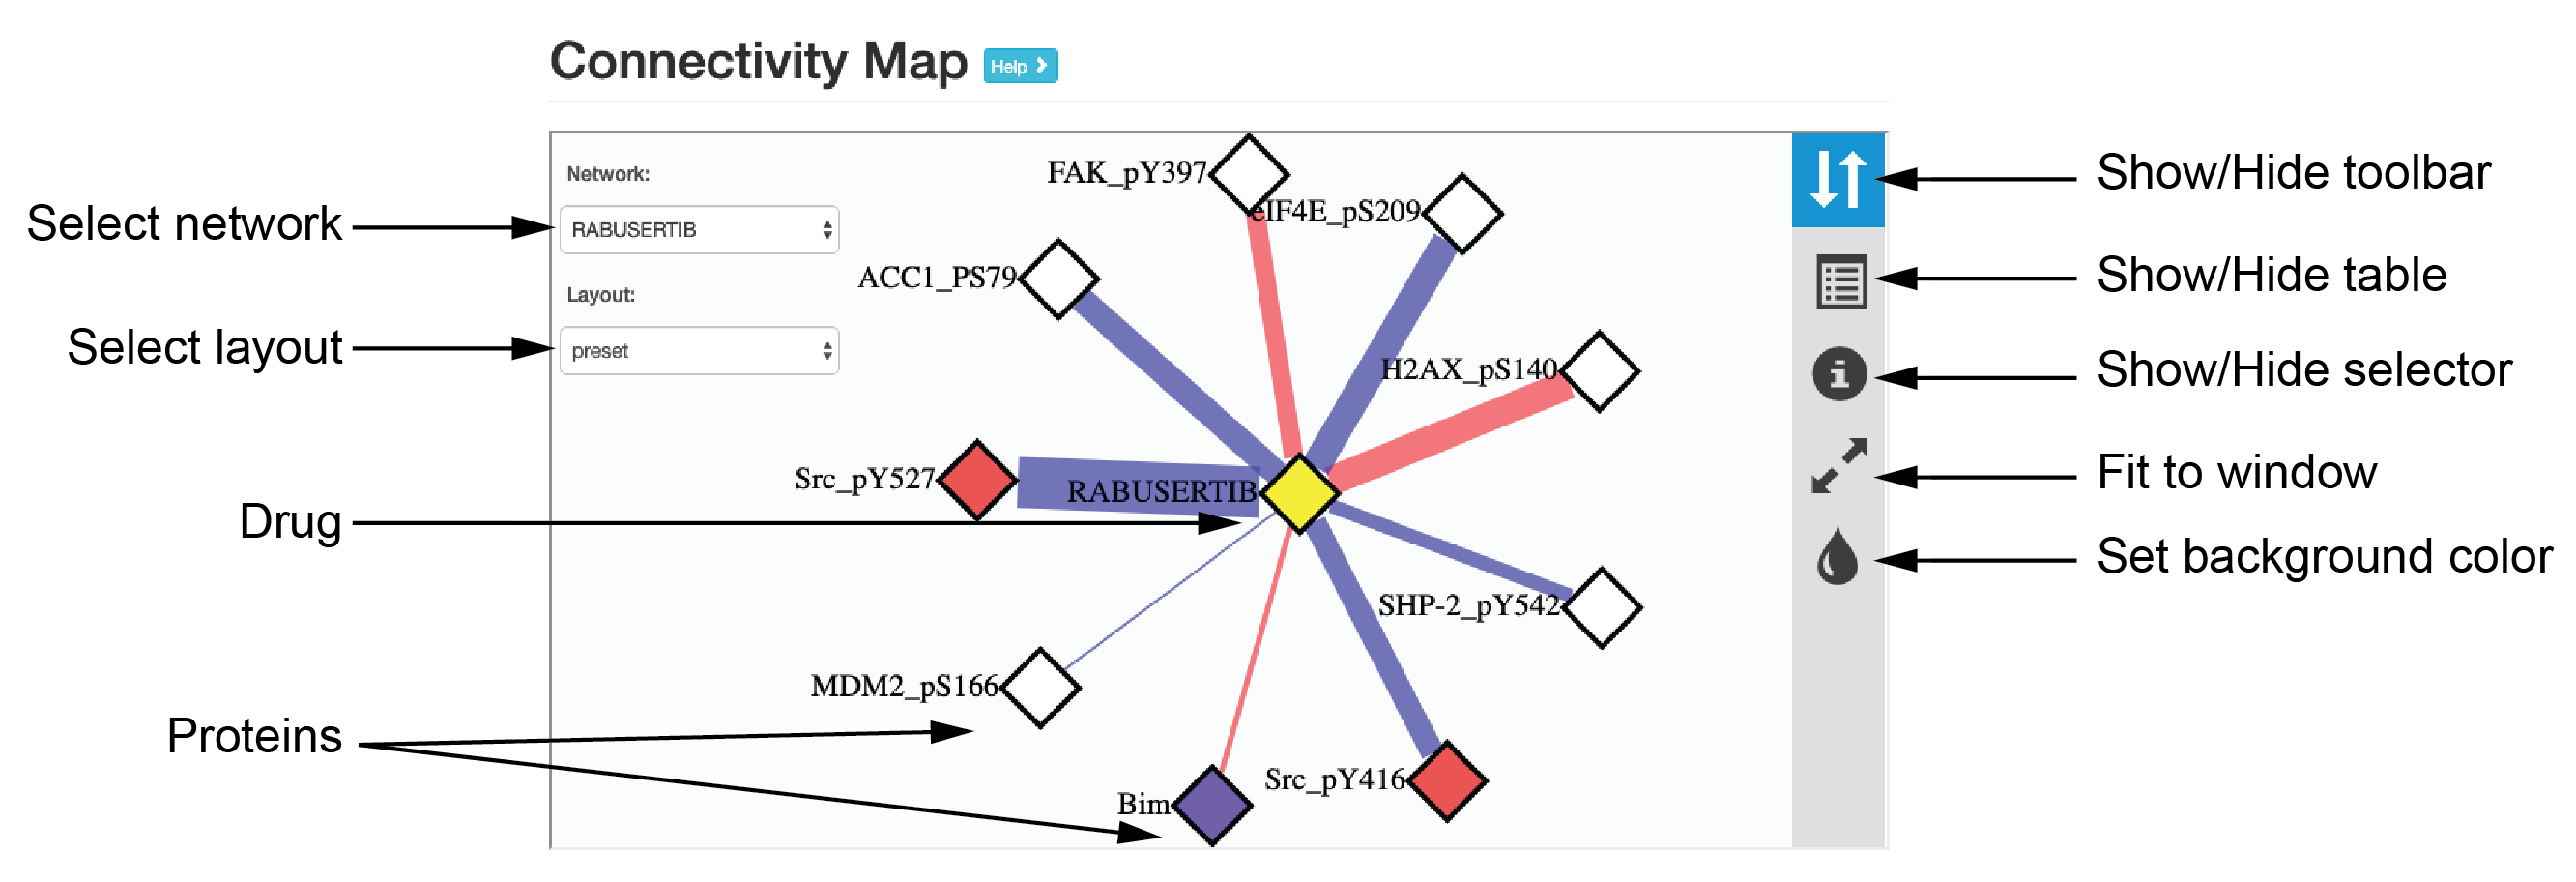
The “Connectivity Map” provides an interactive view for exploring the map, through which protein-drug and drug-drug connectivity can be examined through different visual and layout styles. In the network view, the edge color indicates the response direction of protein markers (red/blue: up/down-regulated in post-treatment). The proteins (nodes) of the same functional pathways are highlighted in the same colors.
Analysis
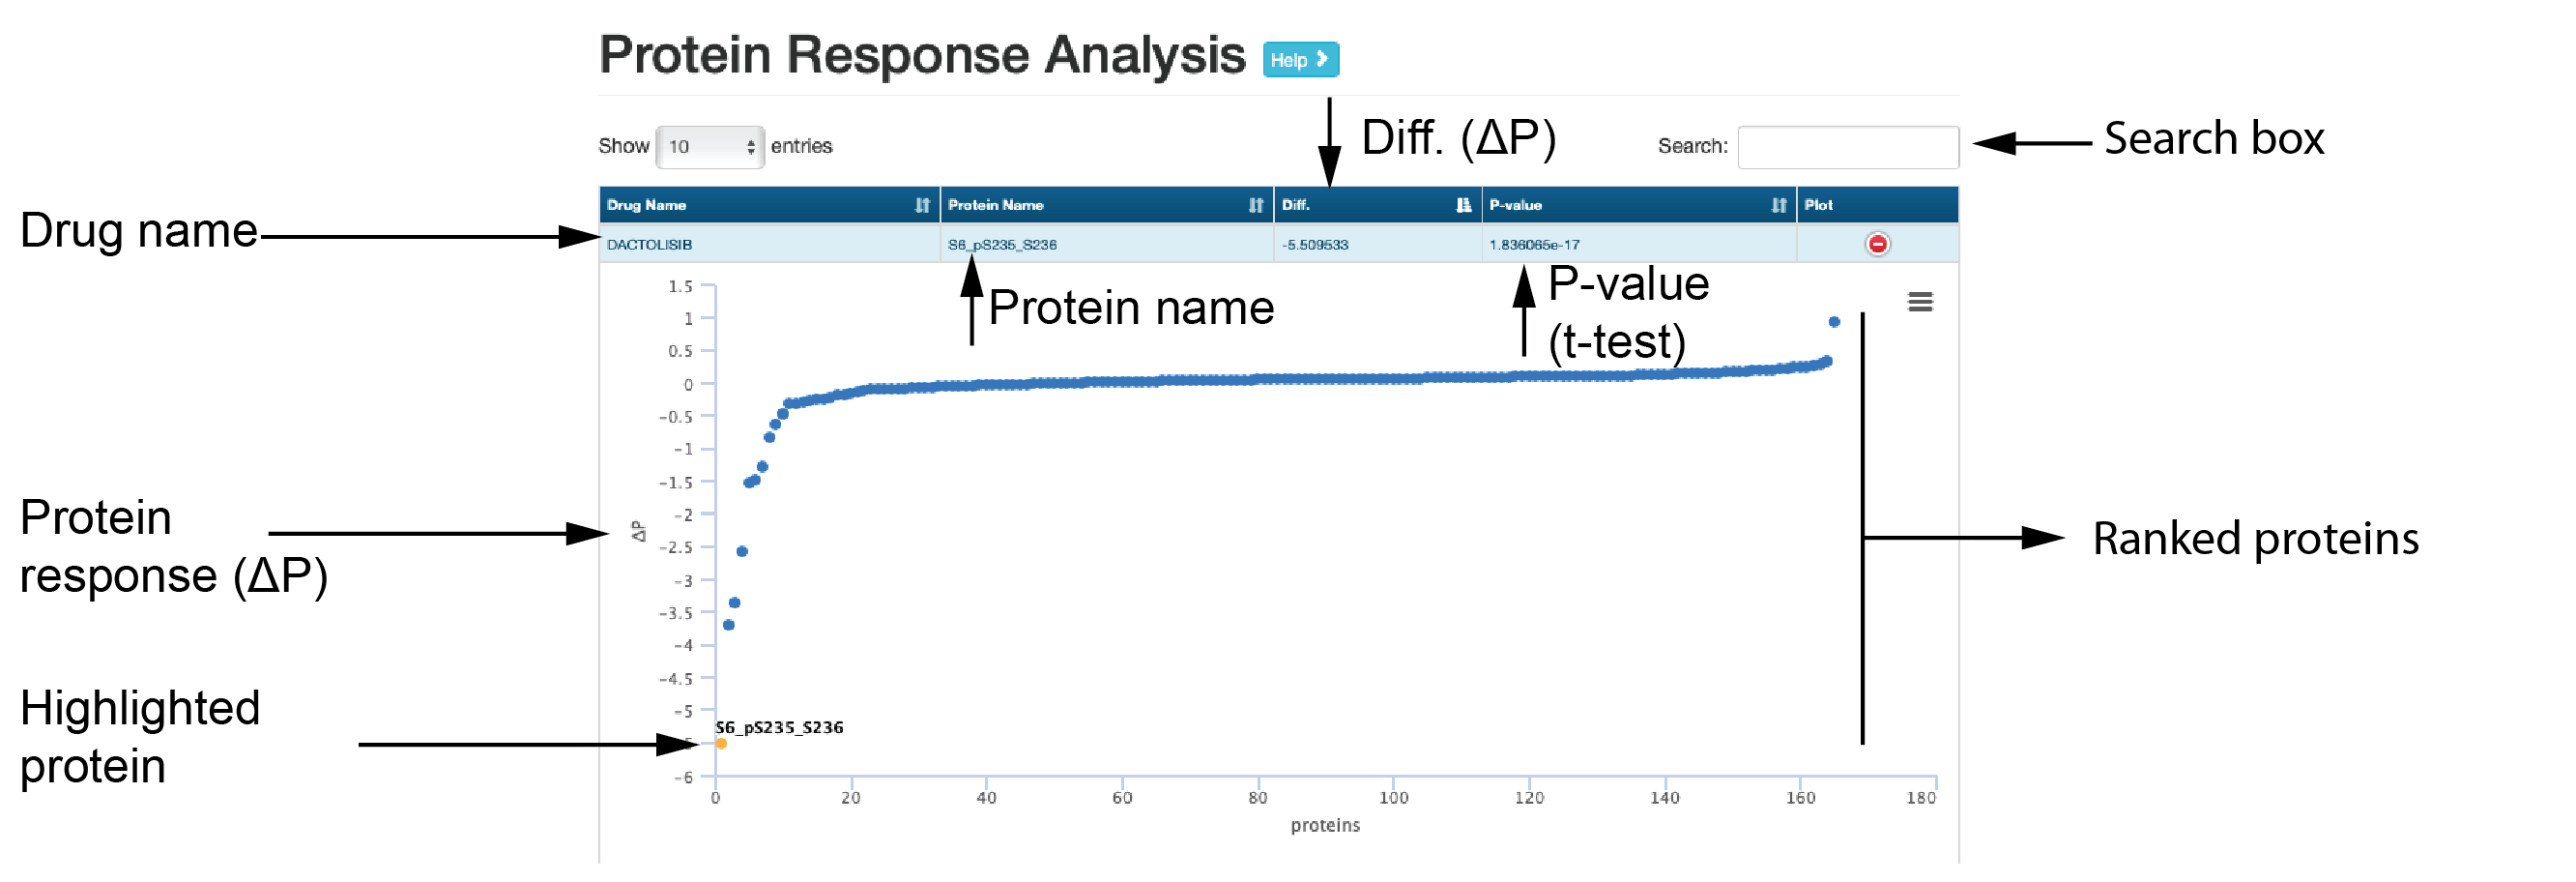
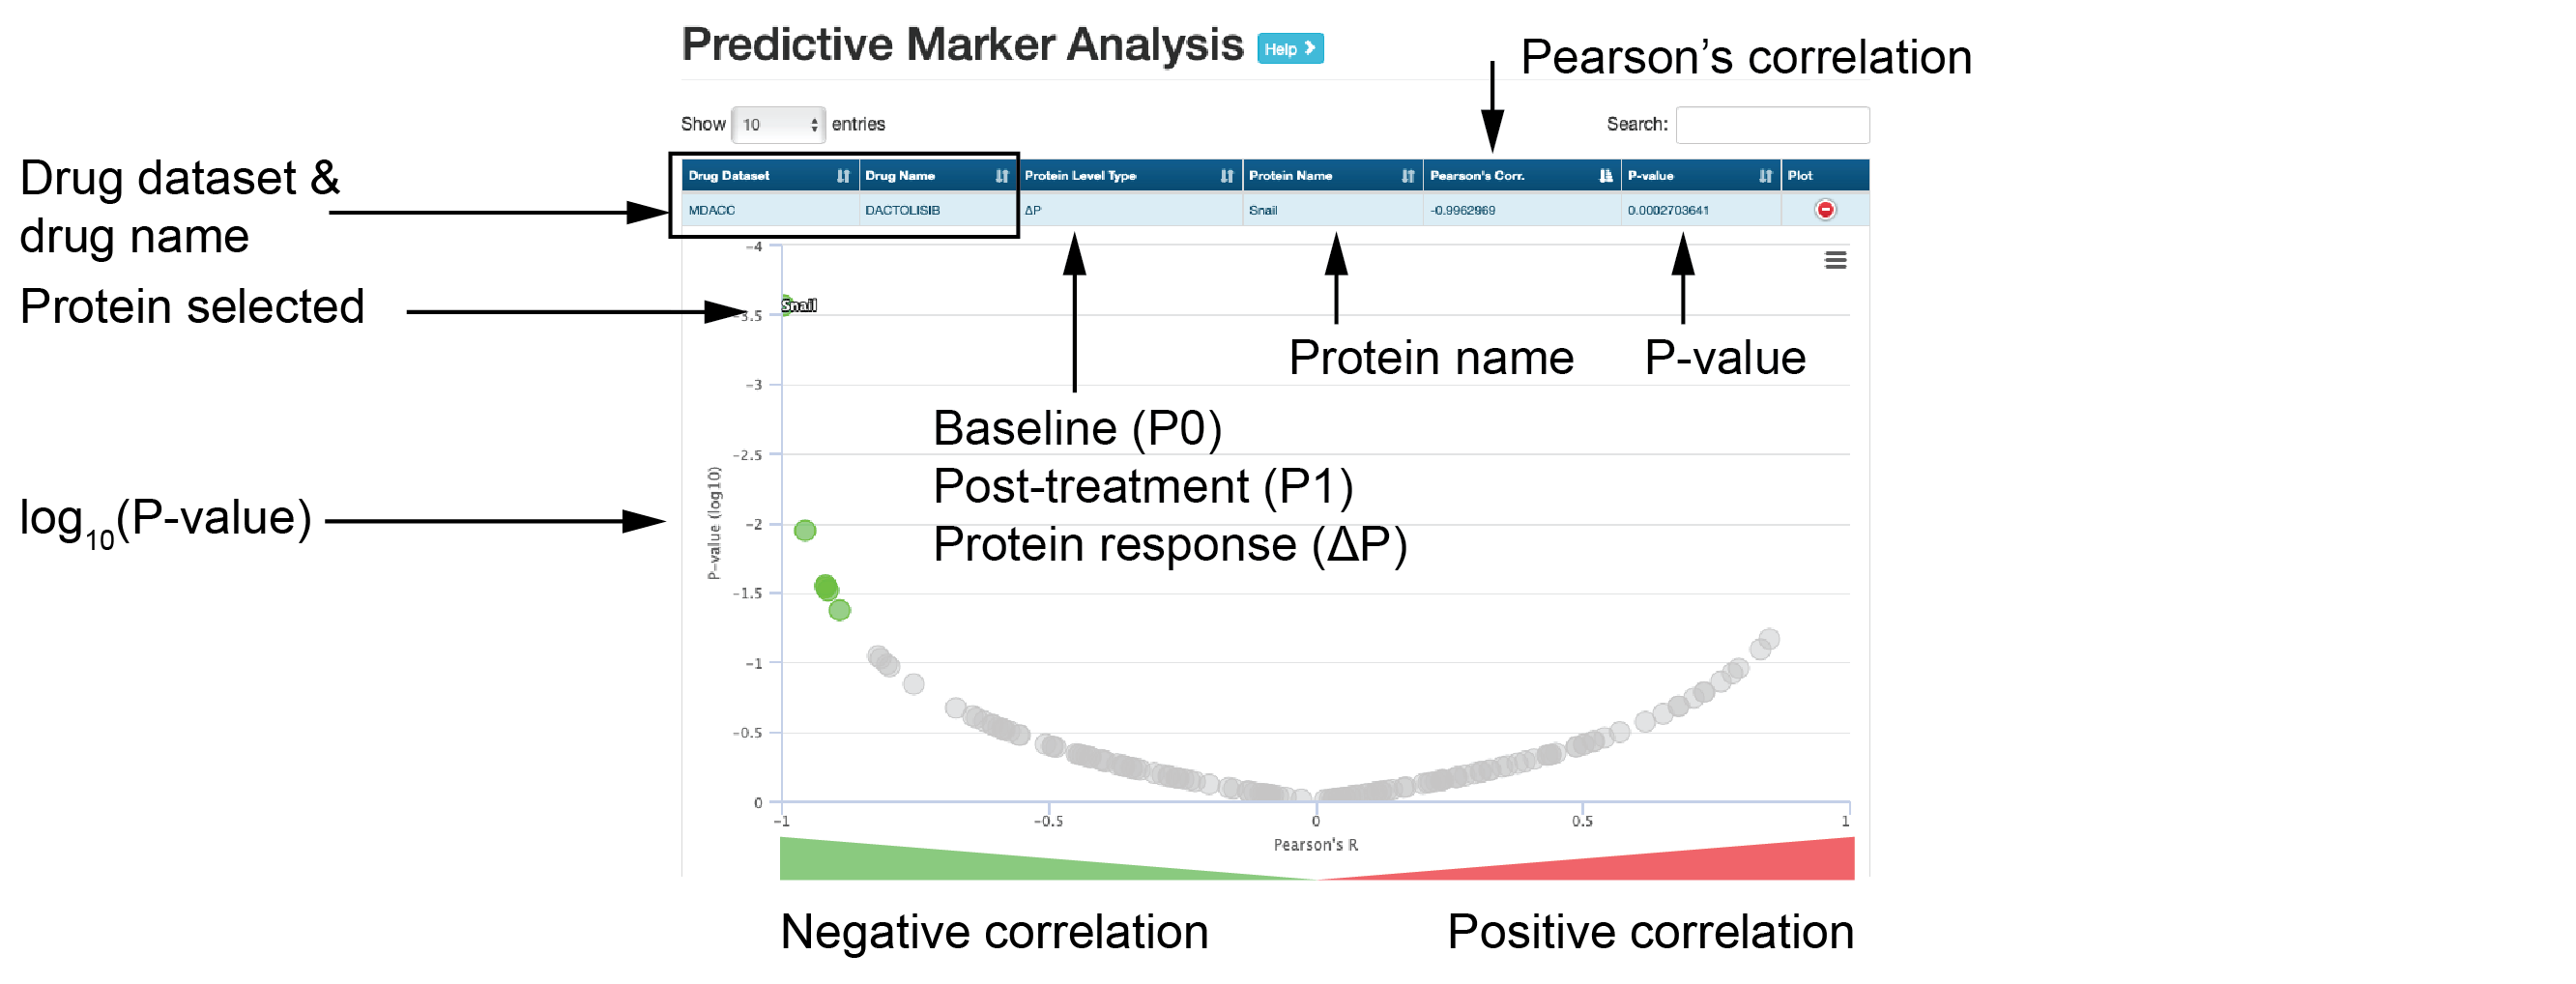
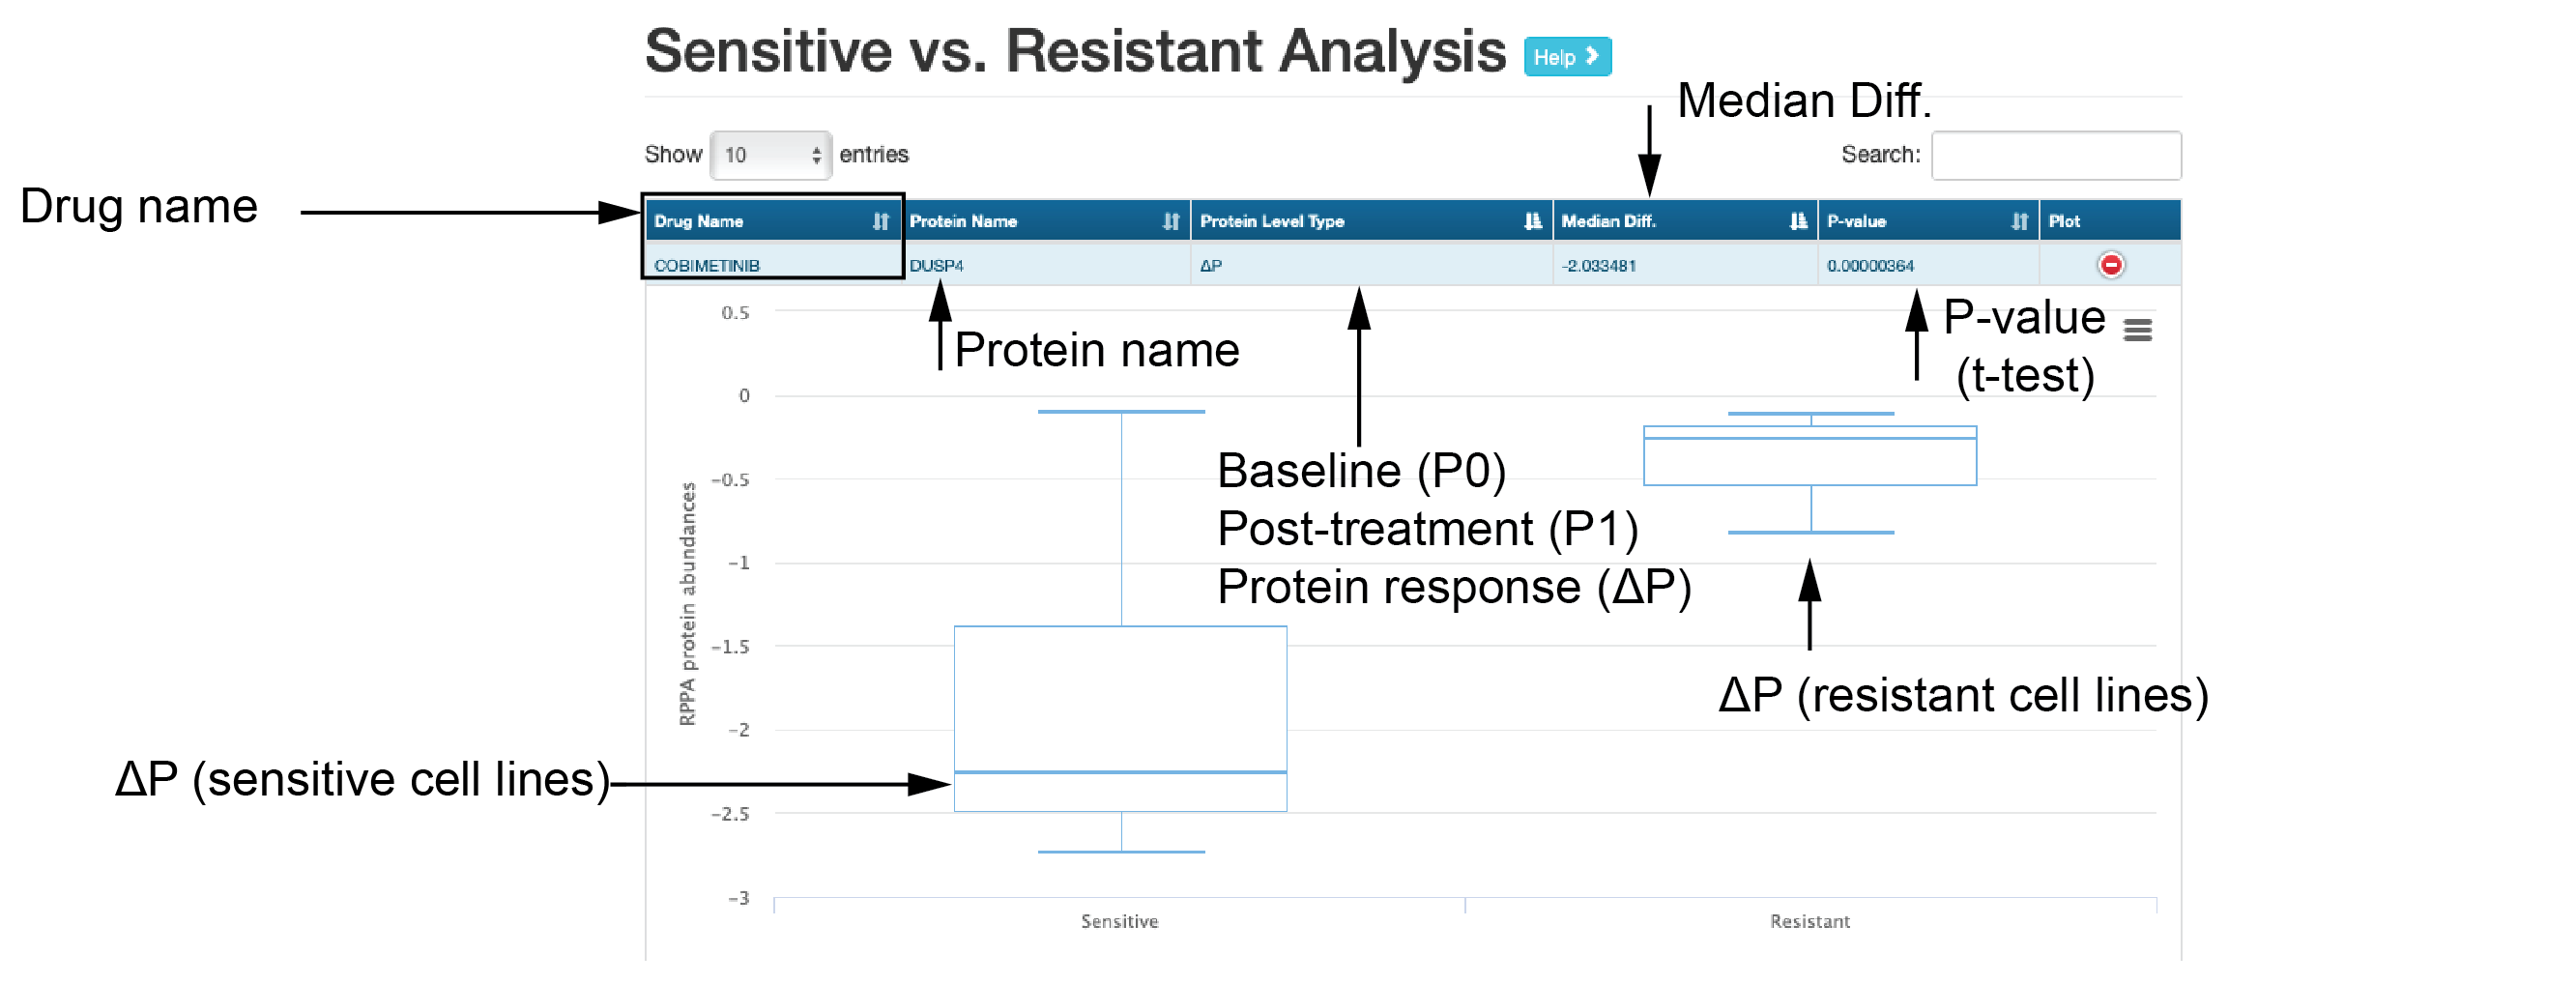
The “Analysis” module provides three common analyses through which users can explore protein responses associated with a drug/compound, including protein response (Δp) rank, volcano plots for the correlations between protein responses and drug sensitivity, and box plots for differential protein responses between sensitive and resistant cell lines.
- Protein response analysis
This submodule shows response of proteins for each drug. The proteins are ranked by ΔP (protein response).
- Predictive marker analysis
The interactive table shows Pearson’s correlations of different protein levels with sensitivity to the drug of interest.
- Sensitive vs. resistant analysis
This submodule shows differential analysis of baseline/perturbed protein expression between sensitive and resistant cell lines.
Frequently Asked Questions
What is functional proteomics?
Functional proteomics is the large-scale study of proteins at the functional activity level, such as expression and modification. Studies of complex diseases such as cancer have shown that genetic alterations do not account for all of the causes of the disease. Changes in protein levels and structure have also been shown to play critical roles in tumor development and progression, which are not reflected by genetic changes. In cancers, several genetic and epigenetic changes are often required for development of the disease. Studying large-scale epigenetic changes such as protein phosphorylation or cleavage will greatly aid in understanding the causes and determining effective treatment of cancers and other complex diseases.
What is RPPA?
Reverse phase protein array (RPPA) is a high-throughput antibody-based technique with the procedures similar to that of Western blots. Proteins are extracted from tumor tissue or cultured cells, denatured by SDS, printed on nitrocellulose-coated slides followed by antibody probe. Our RPPA platform currently allows for the analysis of >1000 samples using at least 130 different antibodies.
What are the advantages of RPPA?
- Inexpensive, high-throughput method utilizing automation for increased quality and reliability
- Sample preparation requirements are similar to that of Western blots
- Complete assay requires only 40 microliters of each sample for 150 antibodies
- Robust quantification due to serial dilution of samples
How are the RPPA data processed?
- Level 1 data
Cellular proteins are first denatured by 1% SDS (with beta mercaptoethanol) and diluted in five 2-fold dilutions in dilution buffer (lysis buffer containing 1% SDS). Serial diluted lysates are arrayed on nitrocellulose-coated slides (Grace Biolabs) by the Aushon 2470 Arrayer and probed with validated antibodies. Signals are amplified by TSA and captured by DAB colorimetric reaction. The slides are then scanned, analyzed and quantified by ArrayPro Analyzer to generate spot intensity.
- Level 2 data
Based on Level 1 data, each dilution curve of spot intensities is fitted using the monotone increasing B-spline model in the SuperCurve R package. This fits a single curve using all the samples on a slide with the signal intensity as the response variable and the dilution steps as independent variables. The fitted curve is plotted with the signal intensities on the y-axis and the log2-concentration of proteins on the x-axis for diagnostic purposes.
- Level 3 data
Based on Level 2 data, the data normalization is processed as follows:
1. Calculate the median for each protein across all the samples.
2. Subtract the median (from step 1) from values within each protein.
3. Calculate the median for each sample across all proteins.
4. Subtract the median (from step 3) from values within each sample.
How do we quantify protein expression and modification?
We use the approach of “SuperCurve Fitting” developed by the Department of Bioinformatics and Computational Biology at MD Anderson Cancer Center to quantify protein expression and modification. Briefly, a “standard curve” is constructed from 5808 spots on each slide (one slide probed for one antibody). These spots include 5 serial dilutions of each sample plus 528 QC spots of standard lysates at different concentrations. Relative levels of protein expression and modification for each sample are determined by interpolation of each dilution curve to the “standard curve” (supercurve) of the slide (antibody).
Can I combine all RPPA data together or RPPA data from different cancers for analysis?
As with any other biological assays, there are batch variations between each RPPA assay. At this time, it is not possible to directly combine the raw or normalized (level 3) protein values. We have developed a replicate-based method to combine RPPA data from different slides , and you should use the RPPA dataset marked with RBN (e.g., pancancer 11 RBN).
Support
For questions or support related to the use of CPPA web app, please contact
Dr. Jun Li
.
For questions about how the RPPA data are generated or antibodies used, contact
Dr. Yiling Lu
.
For other inquiries, contact
Dr. Han Liang
.
Terms of Use
MD Anderson makes no warranties or representations, express or implied, with respect to any of the content, including as to the present accuracy, completeness, timeliness, adequacy, or usefulness of any of the content and MD Anderson will not be liable for any loss or damages arising from your use of or reliance on information contained in this site or other sites that may be linked to from our site. You may view the content contained on CPPA solely for your own personal, non-commercial purposes. You may not copy, transfer, reproduce, modify, or create derivative works of any part of the CPPA content for any reason and you may not use the CPPA content for any commercial purpose (e.g., you may not distribute, license or sell the content, alone or in combination with other materials, to any other person or entity) without the express written permission of MD Anderson. For commercial licensing inquiries, please contact Dr. Han Liang .
This web app is for educational and research purposes only.