MetaBatch Analysis of a Metabolomics Workbench Dataset
Detection of Batch Effects
Diagram details with examples from other datasets is available online.
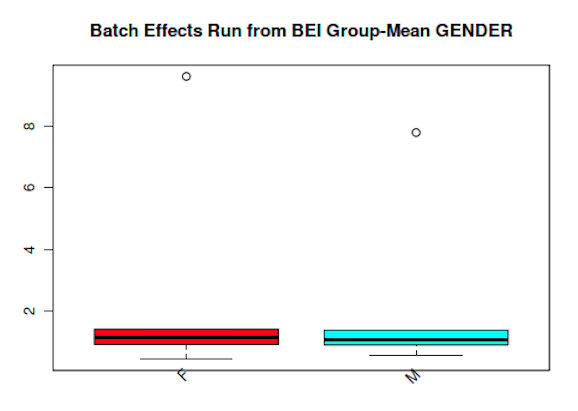
Boxplot Diagrams
Boxplot Analysis is also called Box and Whiskers. Boxplots contain information for one or more samples. Summary information for the data includes a box indicating the interquartile range (IQR) covering 50% of the data points. A line within the box gives the median for the data, indicating half the data points are on each side of that line. Lines outside of each end of the box indicate the maximum and minimum non-outlier values, which are within 1.5 IQR of the median.
Below are examples of static Metabolomics dataset Boxplots. Please refer to our in development viewer which will be part of MetaBatch Web to experience the dynamic boxplots.
Principal Component Analysis Plus (PCA+)
Principal Component Analysis transforms a data matrix such that the larger the data variance provided by an element, the larger the resulting transformed values. The values along each axis are unit-less principal component scores.
In terms of Batch Effects Analysis, this means we can use this to detect variances of the data attributable to batches. For Batch Effects Analysis, we are less concerned with the individual mapping of samples to principal components, and more concerned with mapping between batches. To this effect, we created PCA-Plus, which adds a centroid to each set of batch data and color-codes members of a batch.
Some datasets, such as the one tested here, will not cluster. We have alternative analysis techniques for those datasets. A dynamic PCA+ is available online as part of the in-development viewer for MetaBatch Web as is an example of the non-clustering non-parametric analysis (note the GBM ship date that shows as a batch effect).
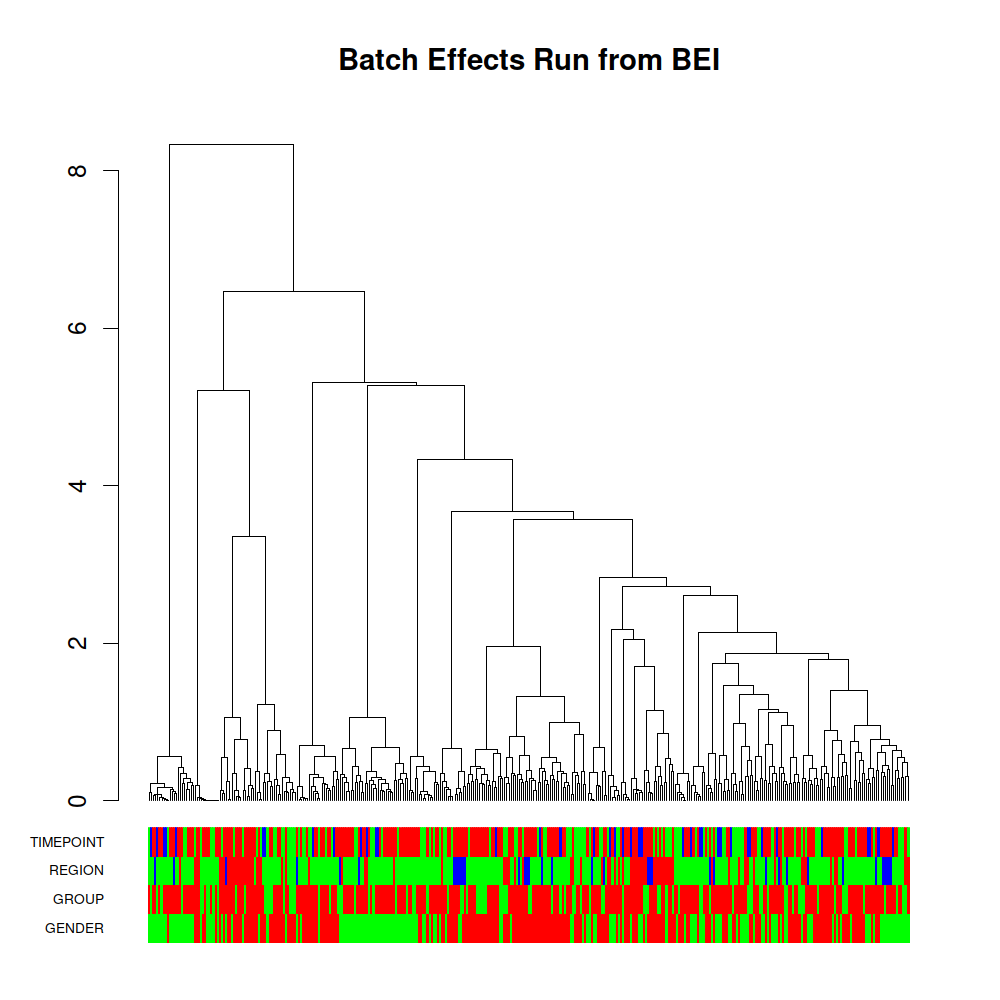
Hierachical Clustering and NGCHMs
Hierarchical Clustering Analysis groups samples based on similarity, based on a correlation calculation and a clustering method. In other words, elements which are more closely correlated are closer together in the cluster. In Hierarchical Clustering diagrams, the vertical axis is the “Height” and gives a measurement of the distance between elements or clusters. For “ward” clustering used in our pipeline runs, this is the amount the sum of squares grows when clusters are combined, which is shown by the height going from 0.0 to some larger number. Colors in the annotation bar have been selected to highlight vertical grouping of related batches whenever possible.
A dynamic hierarchical clustering image, which will be part of MetaBatch Web can be experienced here as part of the in-development viewer for MetaBatch Web.
A static version of Metabolomics Workbench Data is shown here.
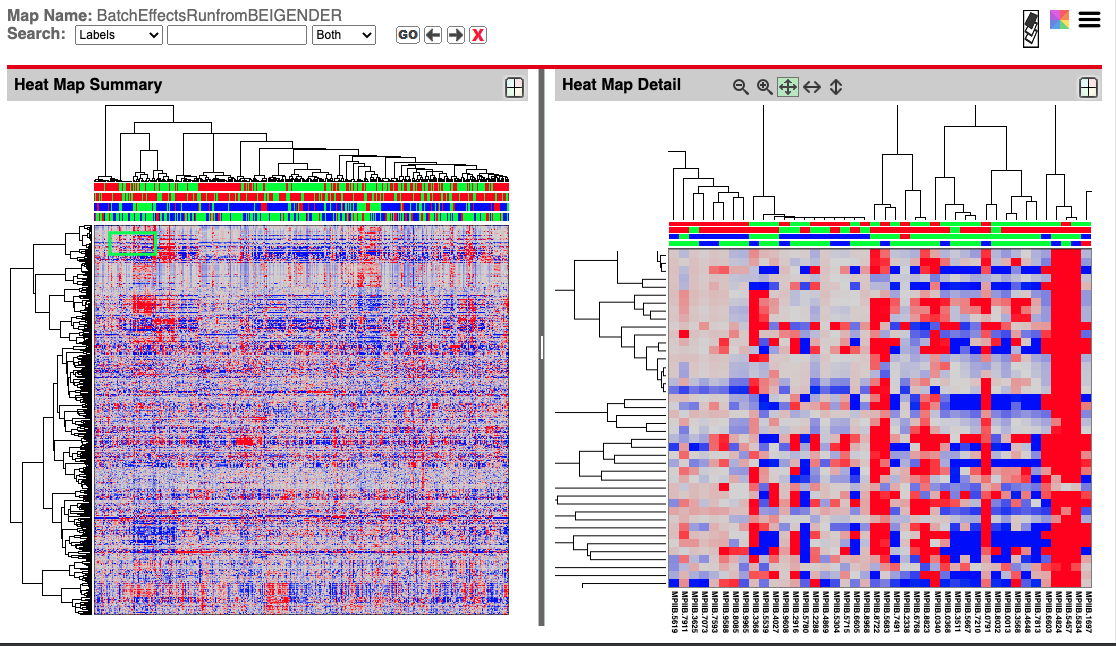
MetaBatch Web Analysis also generates NGCHM versions of the hierachical clustering data (seen below) with a dynamic example here as part of the in-development viewer for MetaBatch Web.
Supervised Clustering
Supervised Clustering Analysis groups samples, based on a distance calculation related to batch membership and a clustering method. Similar to hierarchical clustering, elements which are more closely correlated are closer together in the cluster, but the clustering is “biased” (hence “supervised”) to tend to cluster elements using batch information. Supervised Clustering also adds a simple heat map to show correlation between elements.
In Supervised Clustering diagrams, the vertical axis is the “Height” and gives a measurement of the distance between elements or clusters. For “ward” clustering, this is the amount the sum of squares grows when clusters are combined, which is shown by the height going from 0.0 to some larger number.
Supervised Clustering uses the dynamic NGCHM tool from MD Anderson Cancer Center.
A static version of Metabolomics Workbench Data is shown below while a dynamic version can be used here as part of the in-development viewer for MetaBatch Web.
Kruskal-Wallis and Dunn’s Test
For sparse data, such as non-clustering metablomics data, the MetaBatch performs the Kruskal-Wallis Test by Rank, a non-parametric test ideal for the sparse nature of certain data. The Kruskal-Wallis test by rank gives p-values for significance, with significant deviations having a p-value less than a specified value. We use .00001 as a default. For datasets where Kruskal-Wallis indicates a significant deviation (that is, probably batch effects), we perform a Dunn’s Test to determine which batches or elements are the likely source of the batch effect. The Kruskal-Wallis/Dunn’s Tests are performed on individual sparse data sets. The pipeline will generally perform both sparse and non-sparse analysis on metabolomics data as both provide useful information. An example of Kruskal-Wallis/Dunn’s test non-parametric analysis is available here .