NG-CHM Heat Map Display Properties
The Heat Map Display Properties dialog box, accessed via the gear button in the main controls at the top right of the NG-CHM viewer can be used to review and change many of the visual properties of the NG-CHM you are viewing.
This dialog consists of three sections, the header, the tab, and footer areas.
The Header Area
The header area contains a docking button used to dock the dialog to the left or right side of the browser window, the dialog title, and a close button. The dialog can be moved to a different location within the browser screen by clicking on the header region and dragging the box to the new location.
The Footer Area
The footer area contains three buttons with the following functionality.
| Button | Function |
|---|---|
| Apply | Applies any changes you have made on any of the tabs to the current NG-CHM. |
| Reset | Reverts any changes you have made on any of the tabs to the last applied set of changes. |
| Close | Closes the dialog box. |
The Tab Area
The tab area consists of four tabs, as described below.
| Tab | Function |
|---|---|
| Map Info | Displays general information about the data in the NG-CHM. |
| Heat Map Colors | View and set breakpoints and colors of the main matrix for each layer of the NG-CHM. |
| Rows & Cols | View information about the rows and columns of the NG-CHM, the type of data on each axis, and how the items on the axes are clustered. Provides axis-level controls for axis-related items on the NG-CHM. |
| Covariate Bars | View the names of and control the visibility and height of each covariate that is part of the NG-CHM. |
The Map Info Tab
The Map Info tab displays general information about the NG-CHM as a whole.
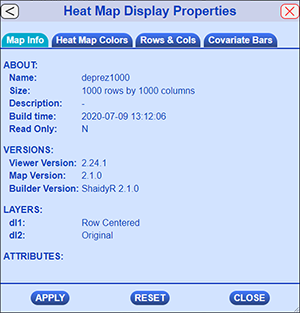
| Section | Field | Description |
|---|---|---|
| About | Name | The name of the map as set by the builder at build time. |
| Size | The number of rows and columns in the NG-CHM. | |
| Description | The description of the NG-CHM as set by the builder. | |
| Build Time | When this NG-CHM was created by some NG-CHM builder software. Note that this is the time the original map was built. If you make and save changes to the a local copy of the file this date will still represent the day the original NG-CHM was built. | |
| Read Only | If the NG-CHM has been downloaded from a server, this field tells whether saving changes you have made to the NG-CHM will update the version on the server as well. If this is a local copy of a map or saving the map to the server is allowed, then the map will not be Read Only and the value will be N. If you are not allowed to save the map back to a server then the value will be Y. | |
| Versions | Viewer Version | The version of the NG-CHM viewer currently being used to view the NG-CHM. |
| Map Version | When major revisions to the underlying architecture of NG-CHMs are made, a new “Map Version” is created. This field tells that version number. This is independent of the NG-CHM Viewer version used to view the NG-CHM. | |
| Builder Version | The software name and the version number of the software the Builder software that was used to create this NG-CHM. | |
| Layers | dl1 | A list of names and values of main matrix layers in the displayed NG-CHM. All NG-CHMs will have at least one layer. |
| dl2 | A list of names and values of main matrix layers in the displayed NG-CHM. All NG-CHMs will have at least one layer. | |
| Attributes | A list of names and values of additional attributes assigned to the NG-CHM by the builder. These are used to provide extra storage for information the map builder may want to have tracked with the NG-CHM that isn’t otherwise automatically tracked by the NG-CHM viewer software. |
The Heat Map Colors Tab
The Heat Map Colors tab allows you to view and set the breakpoints and colors used to display the main matrices of each layer of the NG-CHM.
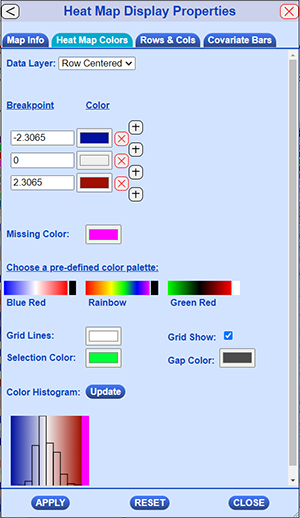
| Section | Field | Description |
|---|---|---|
| Data Layers | Data Layer | Dropdown that allows you to select which layer in the NG-CHM the remainder of the controls on the tab refer to. |
| Breakpoints | View and set at what colors are assigned to the values of the main matrix for the selected layer of the NG-CHM. The controls allow addition and deletion of breakpoints. There must be two or more breakpoints for any NG-CHM. Breakpoint values can not be duplicated and must be listed in ascending order. Values appearing between two breakpoints will appear as a linear average of the Red, Blue, and Green components of the colors that are assigned to the breakpoints on either side of that value. The first and last breakpoint colors will be assigned to all values before the first breakpoint or after the last brakpoint respectively. | |
| Breakpoint | The value at which a new color will be assigned. | |
| Color | The color that will be assigned at that value. | |
| + button | Add a new breakpoint below the + button, i.e. after that breakpoint. If you wish to add a new breakpoint before the first one, you’ll need to add one after the first item and manually copy the breakpoint value from the first to the new breakpoint value and then change the first one to the new value. | |
| x button | Delete the breakpoint value and associated color to the left of the x button. | |
| Missing Color | Missing Color | The color of all cells on the main matrix of the current layer if that value is missingis missing, i.e. has a value of N/A. |
| Palettes | Palettes will change all of the colors of the breakpoints to match those defined in the specific palette. The number of breakpoints and their values will not change. If there are more colors in the palettes than there are breakpoints defined, the first colors of the palette will be used until there are no more breakpoints. If there are fewer colors in the palette than breakpoints then a linear combination of the colors in the palette based on the breakpoint values provided will be calculated to fill out the provided breakpoints. Not this may mean that some colors of the palette will never actually appear in the NG-CHM. For example if You have 5 endpoints but they are not symmetrical around the middle one and you choose the red whit and blue palette, then pure white may never be assigned to any breakpoint. | |
| Blue Red palette button | Sets the breakpoint colors to red for low values, white in the middle, and blue for high values. The missing color is set to black. | |
| Rainbow palette button | Sets the breakpoint colors to use a continous rainbow of colors across the end points defined in the NG-CHM. The lowest value will be set to red and the highest to violet and the others will be set to various colors between dependent on the number of breakpoints that were defined. The missing color is set to black. | |
| Green Red palette button | Sets the breakpoint colors to green for low values, black in the middle, and red for high values. The missing color is set to white. | |
| Grid | Grid Lines | Sets the color of the grid lines displayed between cells if grid lines are displayed. |
| Grid Show | Checkbox to set whether grid lines are displayed between cells or not. If checked grid lines will be drawn between the cells on the NG-CHM. | |
| Other Colors | Selection Color | Sets the color that will be used to display the boxes surrounding the selected cells and the background color of the selected labels in any visible summary and detail panels on the NG-CHM. |
| Gap Color | If the NG-CHM has beed designed to have gaps between rows to separate portions of the, this setting determines the color of the gap regions. | |
| Histogram | Update button | This button updates the histogram that appears below it to the colors you have selected for the NG-CHM to see the current color settings even if you haven’t yet applied the changes to the actual NG-CHM. |
| Histogram | This displays a histogram of the values of the main matrix of the selected data layer and displays how the chosen colors will be applied to those values. |
The Rows And Cols Tab
The Rows And Cols tab allows you to view information about the clustering of the rows and columns on the NG-CHM and configure some of the visual components of the rows and columns of the NG-CHM.
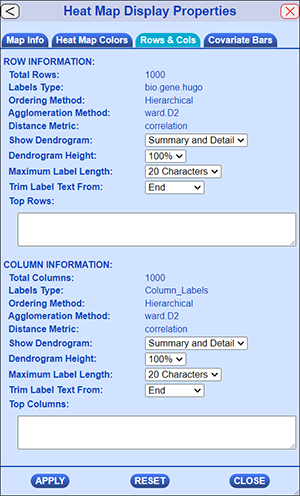
| Section | Field | Description |
|---|---|---|
| Row Information | ||
| Total Rows | Count of the number of rows in the heat map. | |
| Labels Type | Describes the type of data represented by the row and identified by the row label (e.g. Gene Symbol). In advanced maps there can be additional row level metadata which is not displayed. If so these will be shown in this field separated by commas. | |
| Ordering Method | The method used to order the rows in the heat map. Currently can be: hierarchical clustering, original order, or random. | |
| Agglomeration Method | This is applicable only when rows are ordered by hierarchical clustering and describes the algorithm used for clustering. The currently supported methods are: Average Linkage, Complete Linkage, Single Linkage, Ward, Mcquitty, Median, or Centroid. (Note: the NGCHM R package supports all of these; however the online GUI builder does not support Median or Centroid) | |
| Distance Metric | This is applicable only when rows are ordered by hierarchical clustering and describes the metric used to calculate the distance between any two rows. The currently supported metrics are: euclidean, binary, manhattan, maximum, canberra, minkowski, or correlation. | |
| Show Dendrogram | For maps with hierarchical clustering, may be configured to hide/show the dendrogram for rows in the summary panel and/or the detail panel. | |
| Dendrogram Height | Use the dropdown to increase or decrease the amount of space used in the Summary and Detail view for the dendrogram. Increasing the size of the dendrogram will decrease the space available for heat map values and vice-versa. | |
| Maximum Length | Labels may need to be trimmed in the Detail Panel display. This values allows you to increase/decrease the truncation point for labels. Longer labels will leave less room for display of the other heat map elements. | |
| Trim Text From | If labels need to be trimmed, this option sets the method to use to shorten the strings: trim the beginning, remove characters from the middle, or truncate. | |
| Top Columns | Certain rows may be designated as top columns on the NG-CHM. These will be highlighted on the Summary Panel by having the label displayed and a line drawn to the corresponding row in NG-CHM. To designate the rows to be displayed in this manner, enter the label names separated by either commas or carriage returns. Up to ten top items can be displayed on an axis. If more than ten are designated then some will not be displayed. If the labels do not exist on the axis, the wrong separator is used, or more than 10 labels are specified, there will not be notification that this occurred beyond that problematic top items will not be displayed on that axis. | |
| Column Information | The same fields as listed above for rows but applied to columns. |
The Covariate Bars Tab
The Covariate Bars tab allows you to control the visibility and display height for rows or display width for columns of the covariates that are included in the NG-CHM. It also allows you to adjust the colors of the items in each covariate.
At the top of this tab are controls that allow you to filter the list of covariates that will be displayed in the Covariate Bar dropdown below it. This allows you to limit the covariates listed by partial names in case there is a long list. If a filter is applied then the "Filter Covariates" button will change to "Remove Filter" to allow you to revert back to the full list of covariates.
Below that is the Covariate Bar dropdown that change to one of three layouts dependent on the selection made in the dropdown.
Covariate Bar selection - ALL
The default for the value is "ALL". If that option is selected, the layout will display a list of all the covariates defined in the NG-CHM or all of those that have labels that match the filter criteria if one is set.
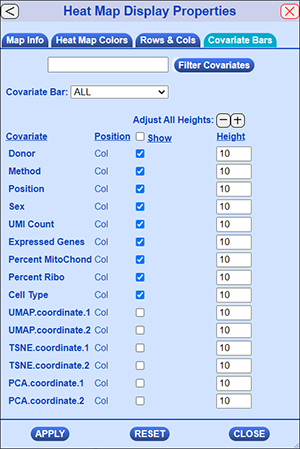
For each of the displayed covariates the following information will be displayed.
| Field | Description |
|---|---|
| Covariate Name | The name of the covariate assigned when the NG-CHM was built. Note: Names of covariates can be the same across axes but will be unique within one axis. |
| Position | The axis on which the covariate appears. Row or Col. |
| Show | Checkbox to set visibility of axis. Checked indicates that the covariate will be displayed on the NG-CHM in any visible Summary or Detail panel. The values of all covariates are available for use in other panels such as Scatterplot panels. |
| Height | The height of a row covariate or the width of a column covariate. Note that these values generally relate to number of pixels, but if there are a large number of visible covariates compared to the total area for a panel, they may scaled to less than one pixel and used as relative heights within the axis region that displays covariates. |
Above the controls for individual rows are controls to change values for all the currently displayed covariates according to the current filter settings.
There is a show checkbox that will set all the currently covariates to be displayed or hidden. There are also + and - buttons to adjust the height/width of all the filtered covariates up or down one unit at a time.
Covariate Bar selection - One discrete covariate
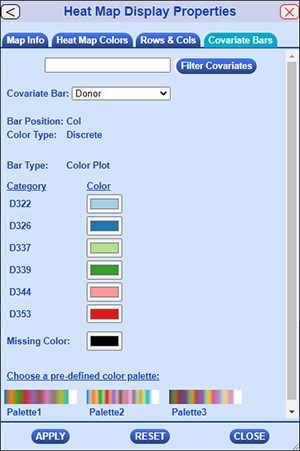
| Field | Description |
|---|---|
| Bar Position | Row |
| Color Type | |
| Bar Type | “Color Bar” is the only Bart Type option for discrete covariates. |
| Category | For each distinct discrete label in the covariate there will be a row showing the label of that distinct value. |
| Color | For each category there will a color control that will allow you to specify the color to display in the covariate bar for any items that have the associated category. |
| Missing Color | The color to use for missing (N/A) values in a covariate. |
| Palettes | Multiple pre-defined color palettes may be available to apply colors to the categories. |
Covariate Bar selection - One continuously-valued covariate
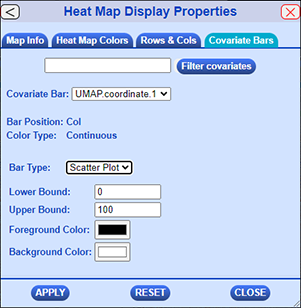
If the selected covariate is a continuous covariate then the tab will display informantion as shown below.
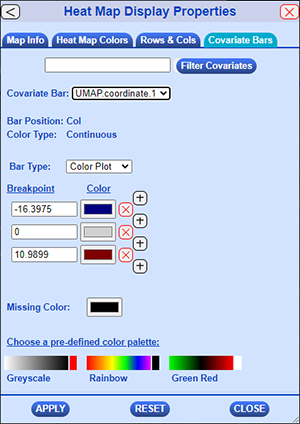
Bar Position specifies the axis this covarite is associated with. Color Type specifies that this is a covariate with real numbered continuous values rather than discrete values.
Bar Type determines how to display the continuous points in the covariate. There are three options, Color Bar, Bar Plot, and Scatterplot, each with distinct configuration settings as described below.
Example of each Bar Type
Note that the column covariates will be displayed similarly but rotated 90 degrees counter-clockwise so the "bottom" in those cases would be the right side of the covariate and the "top" would be to the left.
| Bar Type | Sample Row Covariate Image |
|---|---|
| Bar Plot |  |
| Color Plot |  |
| Scatter Plot |  |
Color Bar Style Covariates
For the color bar style, the rest of the values are for defining the breakpoints and associated colors for the values of this covariate. These work similarly to the controls for the breakpoints for the main matrix layers described in the "Heat Map Colors" tab description above, but apply to the selected covariate covariate. The palette choices are different from those in the main matrix area, but work similarly.
Bar Plot Style Covariates
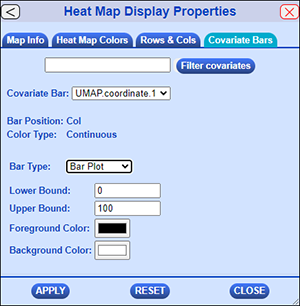
The bar plot style covariate allow you select lower and upper bounds for the range of values to be displayed on the covariate bar. It also allows you to set the foreground and background colors of the covariate. A solid bar of the background color will be drawn and then a solid will be drawn using the foreground color from the bottom of the covariate to the appropriate height in the covariate. If the value for the covariate is higher than the specified upper bound then a solid bar will be drawn in the foreground color from the bottom to the top of the covariate.
Scatterplot Style Covariates
The scatter plot style covariate allow you select lower and upper bounds for the range of values to be displayed on the covariate bar. It also allows you to set the foreground and background colors of the covariate. A solid bar of the background color will be drawn and then points will be drawn using the foreground color at the appropriate height. If the value for the covariate is lower or higher than the specified ranges then a point will be drawn at the bottom or top of the covariate area instead.
