SpliceSeq
| Overview | |
| Description | A tool for investigating alternative mRNA splicing in next generation mRNA sequence data |
| Development Information | |
| Language | Java |
| Current version | 2.1 |
| Platforms | Platform independent |
| License | Freely available for academic and commercial use |
| Status | Active |
| Last updated | February 21, 2014 |
| References | |
| Citation | Ryan, M. C., Cleland, J., Kim, R.G., Wong, W. C., Weinstein, J. N., SpliceSeq: a resource for analysis and visualization of RNA-Seq data on alternative splicing and its functional impacts, Bioinformatics 28 (18) p.2385 (2012). https://doi.org/10.1093/bioinformatics/bts452 |
| Help and Support | |
| Contact | MDACC-Bioinfo-IT-Admin@mdanderson.org |
Data Loading in the SpliceSeq DB
Loading data in the SpliceSeq DB is done with SpliceSeq Analyzer, which is controlled by SpliceSeq Viewer. Below is the overview of data loading on SpliceSeq DB:
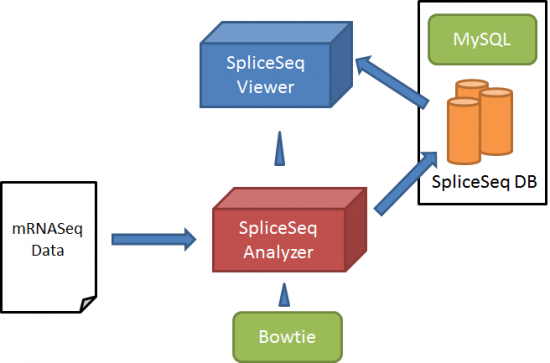
SpliceSeq Analyzer aligns RNASeq sample reads to our pre-constructed splice graphs. The splice graphs identify the known exon structure, splice patterns, and coding regions of genes. The splice graph is assembled using a set of alternative transcript sequences and annotations from a publicly available source of transcript structure. RefSeq, GenBank, UCSC Gene, Sanger Vega, Ensembl and / or AceView models can be used. Currently we have achieved the most intuitive results using the Ensembl transcripts as the source of transcript variants. Ensemble transcripts represent a wide range of splicing variation and retain a high degree of alignment to protein annotation in UniProt.
SpliceSeq Analyzer aligns reads to splice graphs using the original unaligned reads because files containing genome aligned reads often exclude critical splice junction alignments. SpliceSeq Analyzer supports single or paired reads in FASTA or FASTQ format. Reads may be standard nucleic sequence reads or color space reads. For paired reads, the reads should be in two separate files (See bowtie documentation for more details on input file formats).
The data load process has remained the same since version 1.2 of SpliceSeq. To load sample data, you define a study and all the related analysis to be performed and a controller process then performs all data load and analysis steps. To load data, you must have a local installation of Bowtie and SpliceSeq DB. There are two methods that can be used to load local data. The first is to configure and run SpliceSeq Analyzer from SpliceSeq Viewer. This method is easy but the load process can take a long time depending on the number of samples and the computer running the load can’t be turned off while the load is processing. The second approach, is to run SpliceSeq Analyzer from the command line on a server machine. Both approaches are outlined in this chapter.
Configuration for Data Loading
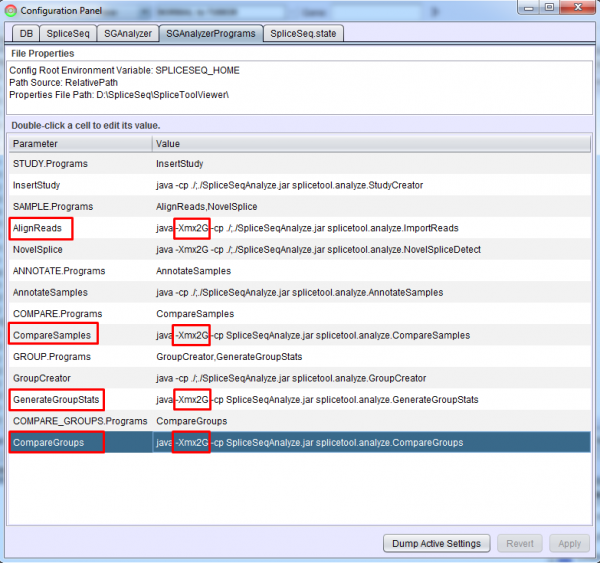
Each analysis step is performed by a controller program which runs as a separate Java process. The SGAnalyzerPrograms tab in the Configuration Panel of SpliceSeq Viewer or the SGAnalyzerPrograms.properties file can be used to adjust the heap space provided to these programs. By default, these are set to use 2 GB of memory. This value can be increased or reduced to fit the local environment but heap errors may occur if it is reduced.
Data Loading via SpliceSeq Viewer
Study Definition List and Study Definition Builder To import samples using SpliceSeq Viewer GUI, select the Load Study Data option from the Data heading in SpliceSeq Viewers menu bar. Note: This menu option will be grayed out if the DBUser on the DB tab of SpliceSeq Viewers Configuration Panel does not have full permission on the SpliceSeq DB onto which samples will be loaded.
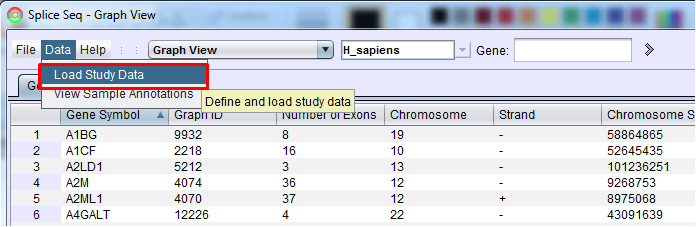
This option will bring up Study Definition List panel that is used to create study definitions and to run SpliceSeq Analyzer to perform study analysis. If there are already Study Definition Files in the list, they can be run by clicking them and pressing Run (the loading will start where it was stopped or had an error previously) or Clean and Run (the loading will clear existing data a do a full run of each analysis step). Clicking a study definition file and Edit button will enable you to edit the study definition. Select the New button to setup your first study.
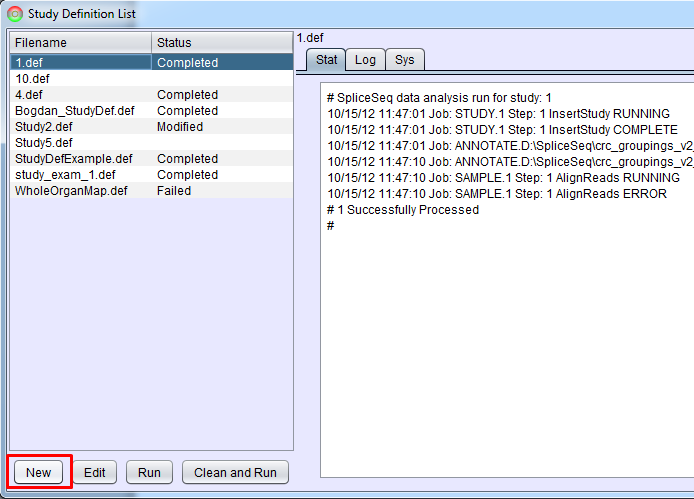
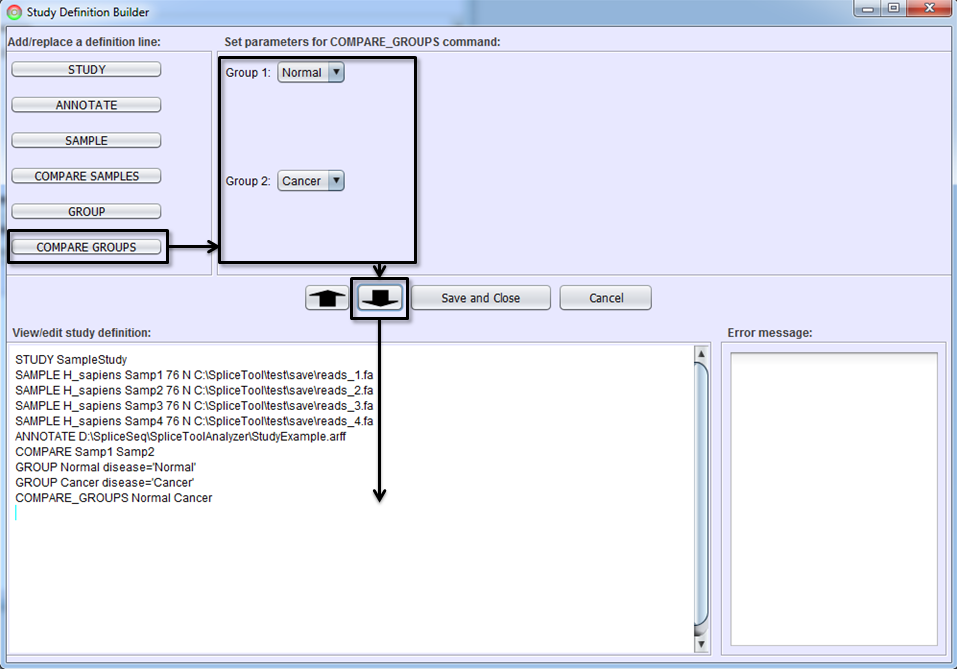
Selecting New or Edit will bring up Study Definition Builder panel that helps with creation or modification of study definitions.
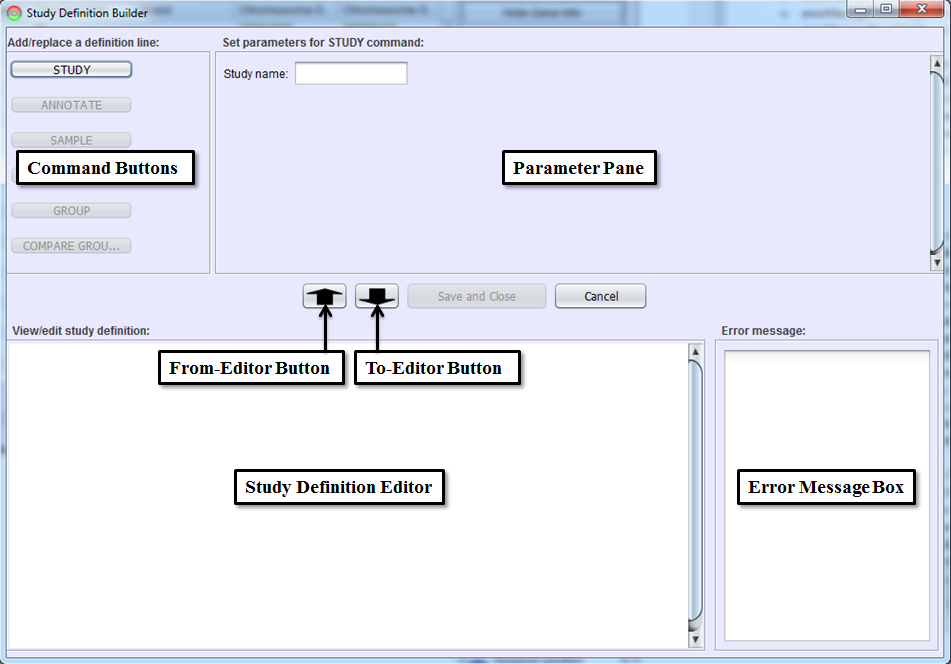
This panel guides you through the process of defining a study. Command Buttons and Parameter Pane are used to write a study definition line (each command line in a study definition file) interactively. Command Buttons will be grayed out until they are valid (e.g. can’t compare samples unless the samples are defined). Parameter Pane defines the parameters for the command selected by Command Buttons. To-Editor Button will add the study definition line made with a Command Button and Parameter Pane to Study Definition Editor.
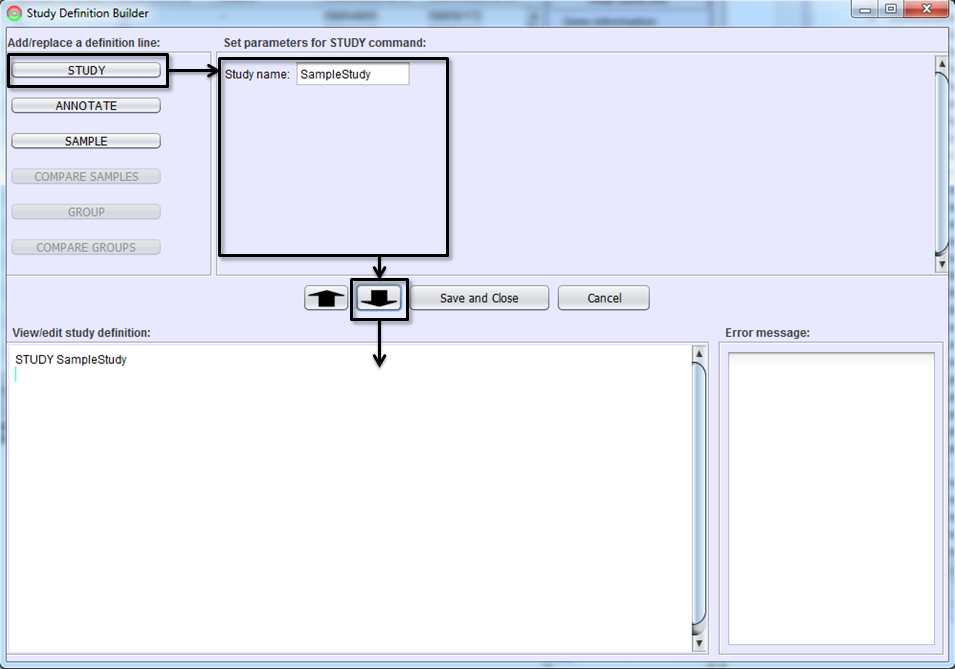
Study Name
Each study must have a unique name. The first step in creating a study definition file is to name the study. Select the STUDY button, type the study name in Parameter Pane, and hit To-Editor Button. A study definition line defining the study name will be added on Study Definition Editor. This then enables the ANNOTATE and SAMPLE buttons.
Defining Samples
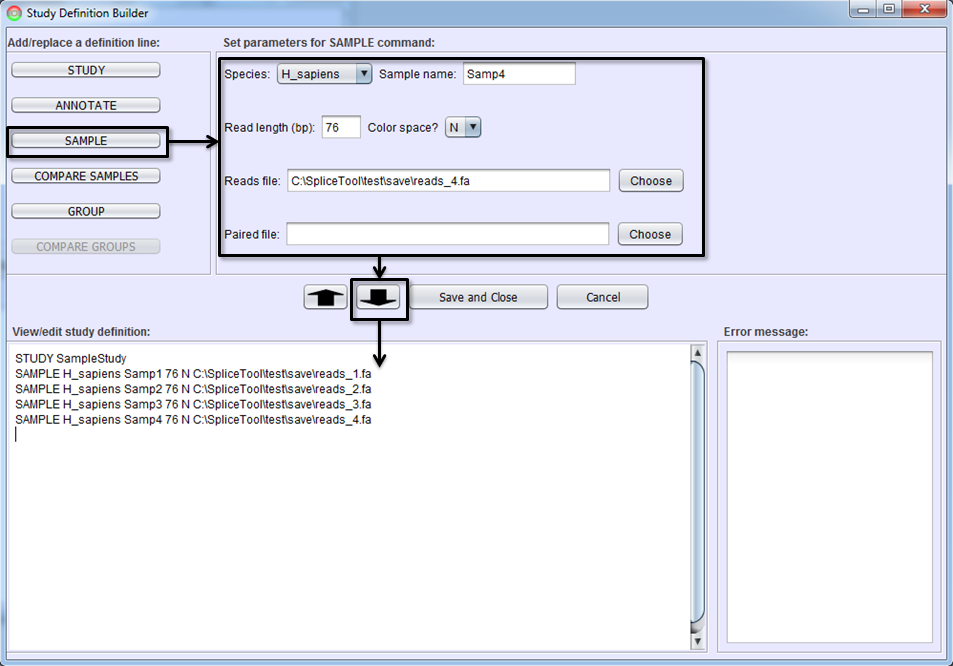
The next step is to add the samples you wish to include in the study. This step will instruct the SpliceSeq Analyzer to align the sample reads from FASTQ or FASTA files to the SpliceSeq splice graphs. Select the SAMPLE button, fill in the parameters and hit the To-Editor Button to add sample(s) to the study definition. Parameters on SAMPLE command lines are:
Species - Organism of the sample.
Sample Name - A unique name for this sample.
Read Length - Length of RNASeq reads used to optimize alignment to splice graphs. For samples with varying length reads, enter the maximum read length (read length not insert length).
Color Space - Y if sample is color space reads N if not.
Reads File - FASTA or FASTQ file with RNA Sequence Reads
[Optional] – Paired file – If the sample is paired reads, the second read of each pair should be in a separate file. This is the name of the paired read file or not provided if sample is not paired end.
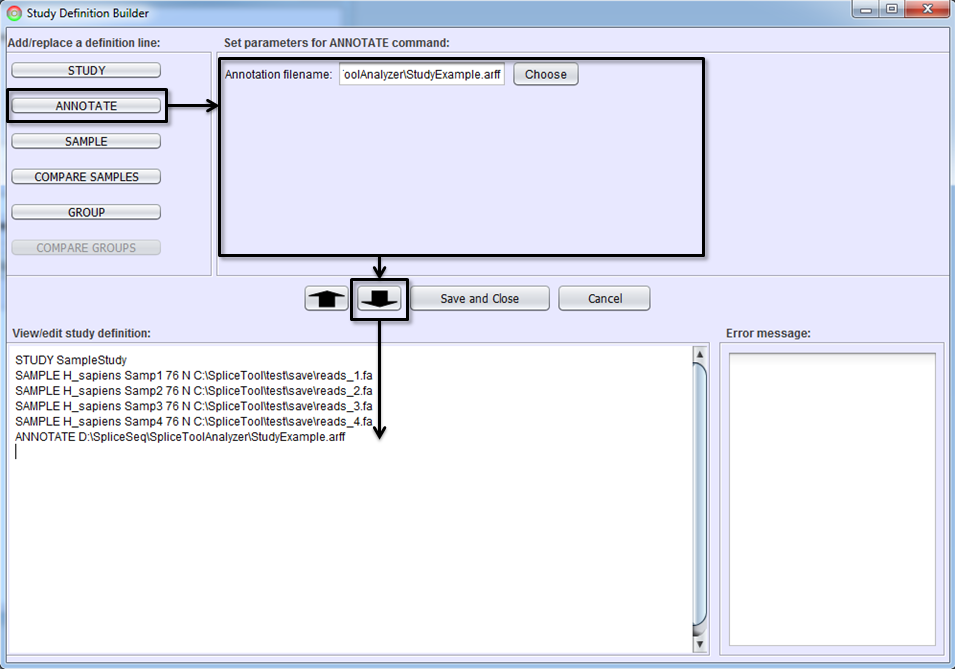
Annotating Samples
This is an optional step but can be helpful in better understanding the samples in a study and can be used to group samples. When working with large numbers of RNASeq samples, it is possible to group the samples and compare the aggregate splicing patterns of the groups (e.g. compare 10 normal lung to 10 cancer lung samples). To support various groupings of samples, SpliceSeq Analyzer stores attributes of each samples that can later be used to create groups.
Sample annotations are loaded from a file in ARFF format. ARFF format is a self describing file format that flexibly supports attributes of various types. See ARFF Specification for details on the format. SpliceSeq Analyzer currently supports the Regular ARFF format not the Spars format. We require the first attribute be a string attribute with the name of the sample (matching the names given to the SAMPLE command lines above). Entries in the ARFF file that do not match loaded sample names will be discarded.
Here is an example ARFF file:
@RELATION tcgacoad
@ATTRIBUTE sample STRING
@ATTRIBUTE age NUMERIC
@ATTRIBUTE gender {MALE, FEMALE}
@DATA
TCGA-AA-A004, 77, MALE
TCGA-AA-A00A, 81, MALE
TCGA-AA-A00D, 70, MALE
TCGA-AA-A00O, 83, FEMALE
TCGA-AA-A00R, 64, FEMALE
To annotate samples, select the ANNOTATE button and identify the ARFF file to be used.
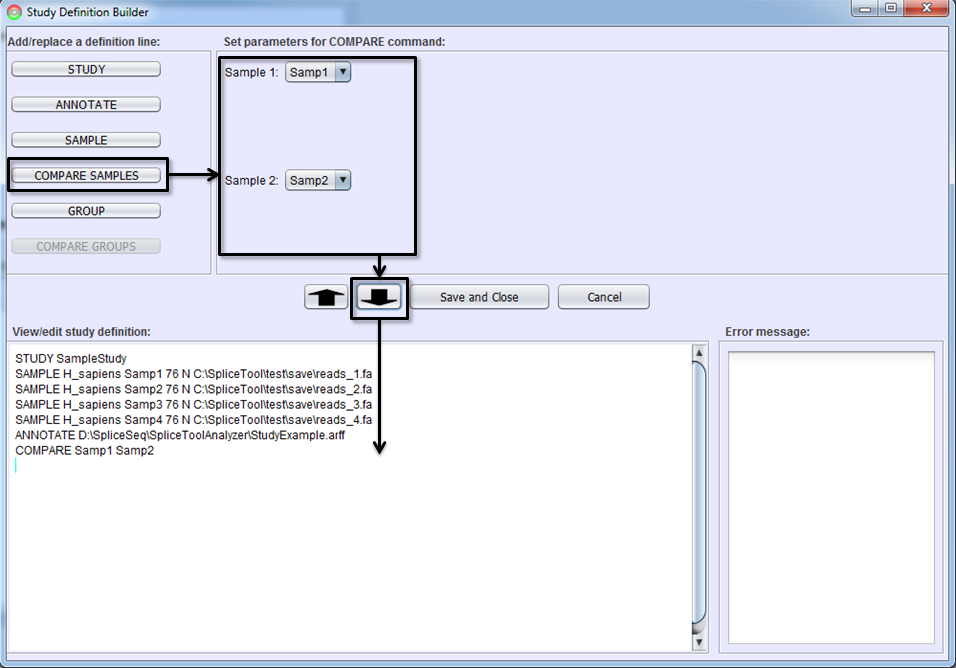
Comparing Samples
If you would like to get a differential splicing analysis between two individual samples (e.g. tumor vs. normal sample from the same patient), select the COMPARE SAMPLES button, identify the two samples to be compared, and To-Editor Button. You must first add the SAMPLE command lines defining samples before adding a COMPARE SAMPLES line.
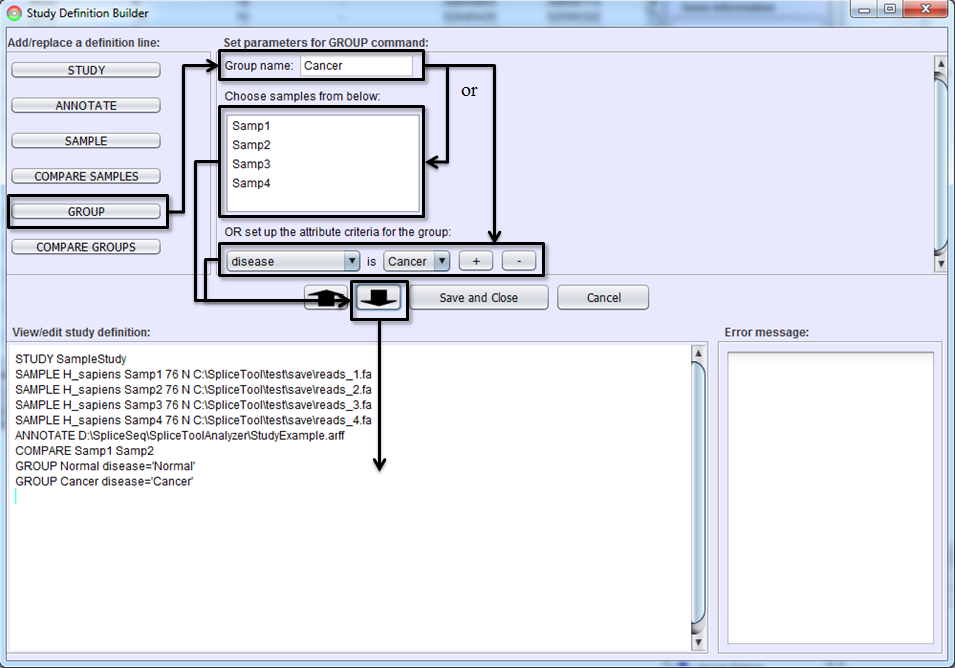
Defining Groups
If you would like to view aggregated splicing patterns or perform differential splicing analysis of groups of samples, you must create sample groups. Select GROUP button, name the group, select samples which will be included in the group, and hit To-Editor Button. Samples may be placed into a group in one of two ways. First, you can manually select the samples in Sample Selection Box. Use shift left-click to select multiple samples. Alternately, you can specify groups via a selection criterion that uses sample attributes. Use Attribute Criteria drop down lists to build selection criterion. If multiple attributes (e.g. sex = male and age > 50) are needed to define a group, use the ‘+’ button to add more criterion.
Comparing Groups
To define a command line for comparing two groups of samples, press COMPARE GROUPS button, choose the two groups in Parameter Panel, and click To-Editor Button.
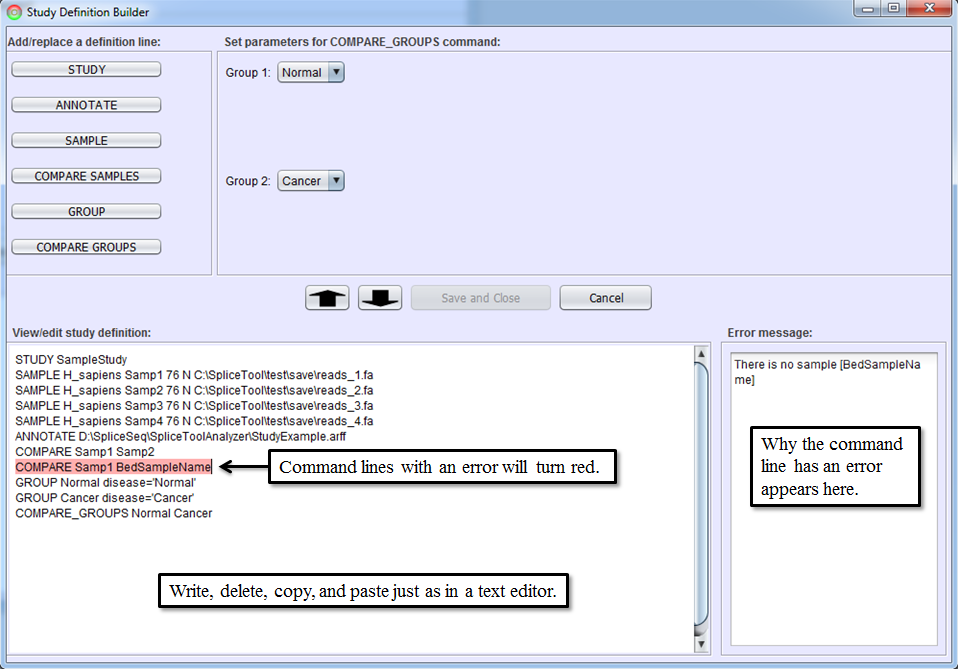
Study Definition Editor
After you become familiar with the syntax of study definition command lines, you may edit them directly in Study Definition Editor. Sections can be copied by dragging them with the mouse and using CTRL-C (for copy) followed by CTRL-V (for paste). Lines can be edited or added by typing anywhere in the editor. The editor performs real-time syntax checking. A command line will turn red and a message will appear in Error Message Box if the command line contains syntax errors. All errors must be corrected before Save and Close button is enabled.
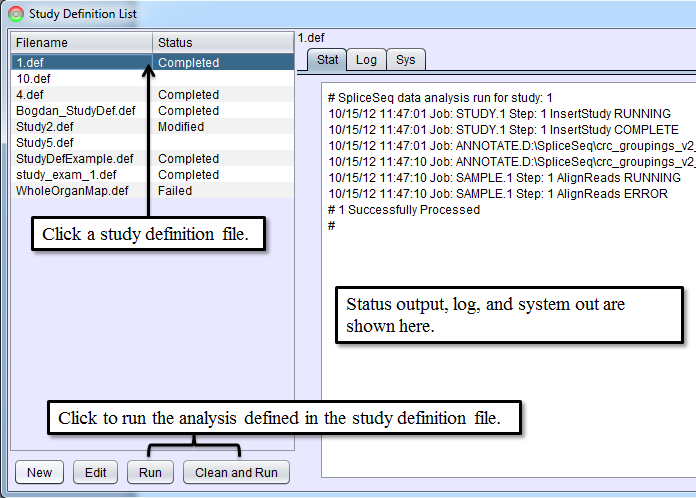
Running Study Definition Files
After writing a study definition is complete, click Save and Close button. This will return you to Study Definition List panel and now the new study definition file will be listed in the selection box on the left. Data for the study can now be loaded and analyzed by selecting a study definition file from the list and clicking Run or Clean and Run button. Run will resume the data loading process for the study definition file if it has been stopped. Clean and Run will start the data loading process from the beginning. Both Run and Clean and Run will start SpliceSeq Analyzer as a separate Java process and SpliceSeq Analyzer will perform data load and analysis. Status updates as the analysis runs can be seen in the tabs on the right of Study Definition List. Aligning reads can take several hours depending on the number of samples and size of the reads file. SpliceSeq Viewer can be closed while SpliceSeq Analyzer runs in the background, but the computer where the analysis runs must not be powered off. The status of the analysis can be reviewed by restarting SpliceSeq Viewer and going to Study Definition List and clicking on the study definition file for the analysis.
If any errors occur during the analysis, the status of the study on Study Definition List will change to Failed and the Stat, Log, or Sys tab will contain error messages. Processing can be restarted if a job is in the Failed state by selecting the study and clicking Run button. Steps that were previously completed successfully will not be reprocessed. If you wish to clear all the study data from the database and reprocess it from scratch, select Clean and Run button.
After a study has been successfully loaded, its status will be Complete. If you later decide that you wish to perform additional analysis on the samples (e.g. add new groups and do a group comparison), you can edit the study definition by selecting it and clicking Edit button. Definition lines can then be added to the study. After the changes are saved, select the study and again click Run button. Steps that were previously successfully completed will not be rerun but the new steps will be run and the status will be Complete when they finish.
Command Line Data Loading via SpliceSeq Analyzer
Rather than running data analysis from SpliceSeq Viewer, it may be preferable to run the analysis on a server machine. This can be done by running SpliceSeq Analyzer from the command line. The command line analysis is run using the same SpliceSeq Analyzer process that uses a study definition file for specifying the data and analysis steps. One way to get a study definition file is to use the GUI as outlined above to create the file. After clicking Save and Close, the study definition file will be saved in the directory where SpliceSeq Viewer is installed. The file name will be the same as the study name + “.def”.
Alternately, if you are familiar with the syntax of study definition files, you can create the file directly using a text editor. Here is a sample study definition file:
STUDY SampleStudy
SAMPLE H_sapiens Samp1 76 N C:\SpliceTool\test\save\reads_1.fa
SAMPLE H_sapiens Samp2 76 N C:\SpliceTool\test\save\reads_2.fa
SAMPLE H_sapiens Samp3 76 N C:\SpliceTool\test\save\reads_3.fa
SAMPLE H_sapiens Samp4 76 N C:\SpliceTool\test\save\reads_4.fa
ANNOTATE C:\SpliceTool\test\save\test.arff
COMPARE Samp1 Samp3
COMPARE Samp2 Samp4
GROUP Cancer disease='Cancer'
GROUP Normal disease='Normal'
COMPARE_GROUPS Normal Cancer
To run the analysis, a local copy of SpliceSeq Analyzer must be installed on the server (see Local Installation). The command to run the SpliceSeq Analyzer is:
$ java -cp <SpliceSeqAnalyzer Dir>:<SpliceSeqAnalyzer Dir>/SpliceSeqAnalyze.jar splicetool.analyze.AnalysisController <Study Definition File> [Reload]Arguments to the command line are as follows:
<SpliceSeqAnalyzer Dir> - the directory where SpliceSeq Analyzer is installed. This needs to be in the classpath so that the analyzer process can find its properties file.
[Reload] – Optional. Add ‘Reload’ if you want previous study data to be cleaned out and for all analysis to be performed from scratch. This is the same as clicking Clean and Run in Study Definition List panel.
As the controller runs, it will write high-level status of each step to a file called
Comparison.
If you get class not found errors on a job step, you may need to fully qualify the classpath items on the java executable line in the SGAnalyzerPrograms.properties file to point to the SpliceSeq install directory. For example:
InsertStudy = java -cp /home/mike/bin:/home/mike/bin/SpliceSeqAnalyze.jar splicetool.analyze.StudyCreator
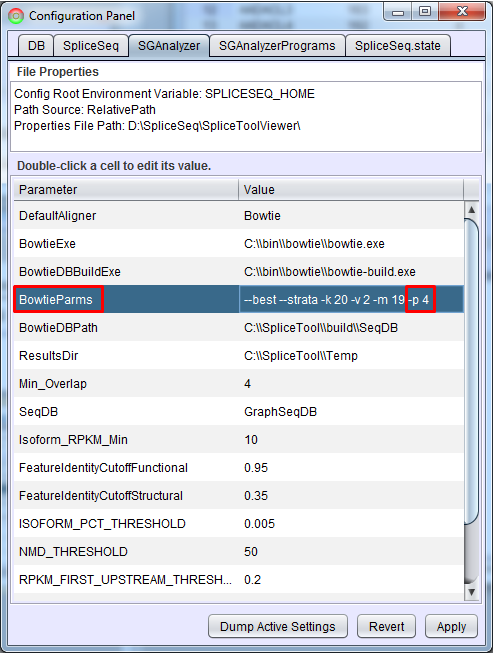
Performance
Data load performance can be improved by increasing the number of concurrent threads run by Bowtie. In SpliceSeq Viewer, open Configuration Panel (Help - Configuration Panel…) and click SGAnalyzer tab. Add a -p option to BowtieParms. Generally the maximum value here would be the number of CPU cores on the machine where the analysis is running. If you are running analysis on the command line, you can just edit the SGAnalyzer.properties file directly in the local installation of SpliceSeq Analyzer to add this value.