SpliceSeq
| Overview | |
| Description | A tool for investigating alternative mRNA splicing in next generation mRNA sequence data |
| Development Information | |
| Language | Java |
| Current version | 2.1 |
| Platforms | Platform independent |
| License | Freely available for academic and commercial use |
| Status | Active |
| Last updated | February 21, 2014 |
| References | |
| Citation | Ryan, M. C., Cleland, J., Kim, R.G., Wong, W. C., Weinstein, J. N., SpliceSeq: a resource for analysis and visualization of RNA-Seq data on alternative splicing and its functional impacts, Bioinformatics 28 (18) p.2385 (2012). https://doi.org/10.1093/bioinformatics/bts452 |
| Help and Support | |
| Contact | binf@insilico.us.com |
Graph View
Graph View provides a means of exploring our database of composite splice graphs. This view is always available, even when no samples have been loaded into the database yet. This view is useful for determining if a splice graph has been assembled for a given gene in a given species, and if assembled, to see what it looks like.
To get to this view, first select Graph View in the View Combobox in the Data Selection Bar. Next, select the species that you wish to investigate using the DataSet Combobox also in the Data Selection Bar.
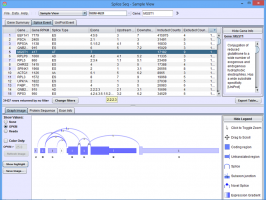
Graph View Results Panel
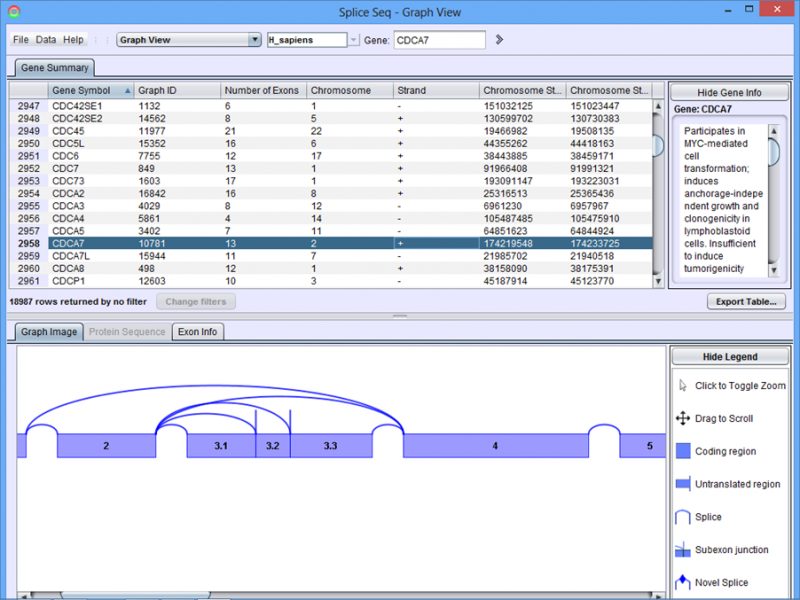
Gene Summary Tab in the Results Panel lists all of the genes for which a splice graph has been assembled. The table may be sorted by any of the columns by clicking on the header. The Find Symbol box can be used to jump to a specific gene symbol (type symbol and hit enter). Click on a row in the table to see the associated splice graph.
Graph View Detail Panel
Graph Image Tab in the Detail Panel shows the splice graph for the chosen gene. Each graph shows the exon structure, UTR regions, and alternate splice paths for a gene.
To get the details of the exons in each gene, click on the Exon Info tab.