
SpliceSeq
| Overview | |
|---|---|
| Description | A tool for investigating alternative mRNA splicing in next generation mRNA sequence data |
| Development Information | |
| Language | Java |
| Current version | 2.1 |
| Platforms | Platform independent |
| License | Freely available for academic and commercial use |
| Status | Active |
| Last updated | February 21, 2014 |
| References | |
| Citation | Ryan, M. C., Cleland, J., Kim, R.G., Wong, W. C., Weinstein, J. N., SpliceSeq: a resource for analysis and visualization of RNA-Seq data on alternative splicing and its functional impacts, Bioinformatics 28 (18) p.2385 (2012). https://doi.org/10.1093/bioinformatics/bts452 (opens in new tab) |
| Help and Support | |
| Contact | MDACC-Bioinfo-IT-Admin@mdanderson.org |
Group View
The Group View is used to study aggregate splicing patterns of a group of samples. To use this view, the groups must have already been loaded into the database. (See Loading Data for information on creating groups.)
The Group View is generally similar in function to the Sample View, with the only major difference being that the Group View presents the average statistics for the members of the group. (e.g. if a group has three samples with 10, 15 and 20 reads in Exon A respectively, then the average read total for Exon A will be 15) Likewise, all numerical values such as PSI and magnitude would all be derived from average statistics.
To get to this view, first select Group View in the View Combobox in the Data Selection Bar . Next, select the group that you wish to investigate using the DataSet Combobox also in the Data Selection Bar.
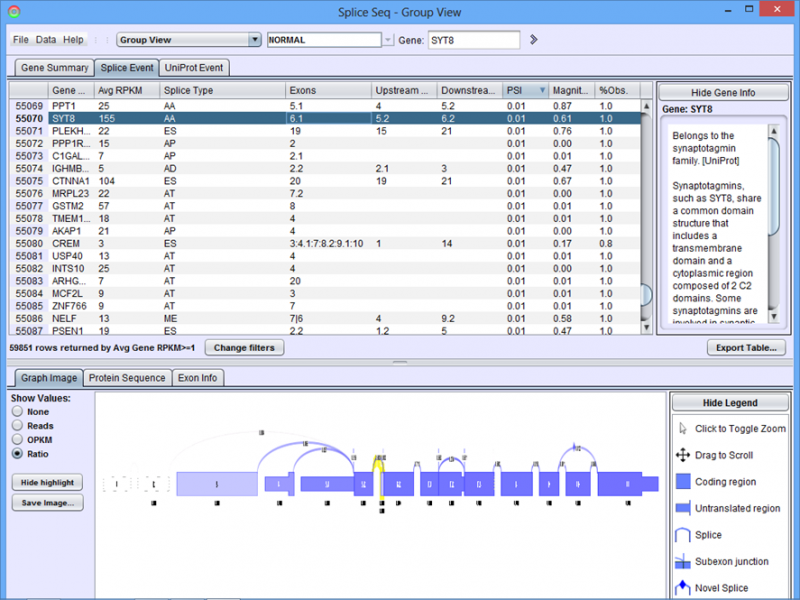
When the group loads, the Results Panel will be loaded with all the splice events identified in the chosen group.
Group View Results Panel
Gene Summary Tab of the Results Panel allows you to sort, filter, display, and export the results for each gene in the currently selected group.
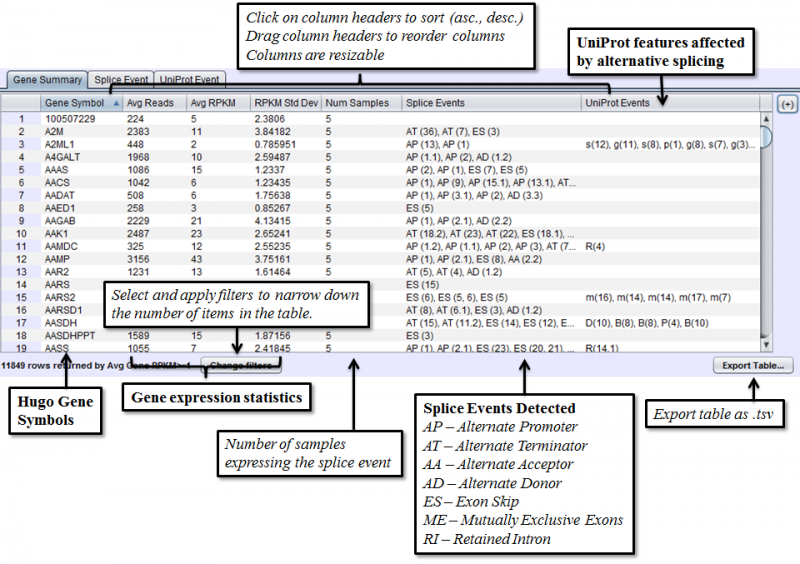
The columns that require further explanations are::
- Num Samples- number of samples in the group expressing this splice event. If a gene is not expressed in a particular sample, then that sample would not be counted towards this number for any splice events detected in that gene.
- Splice Events - Categorized list of the differential splice events detected in the group on average. For example, ES(4) indicates and exon skip on exon number 4 that occurs more frequently in one sample. Use the Splice Event Filter drop down list to see the description and codes for each event type.
- UniProt Event - Categorized list of UniProt annotated regions that are affected by alternate splicing events in the group on average. For example, B(9) indicates a Bind Site on exon 9 that is excluded more frequently in one sample’s isoforms. See the legend in the Protein Sequence Tab of the Gene Panel for a full list of UniProt annotation categories.
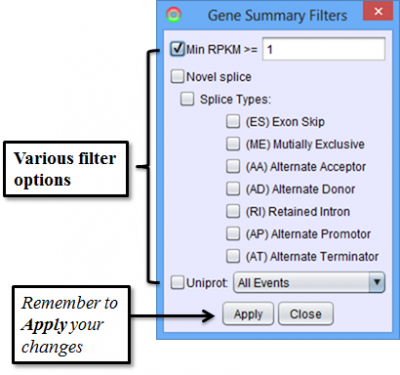
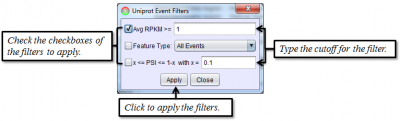
To access filtering functions for the table, use the Change filters button. The following filters are available:
Splice Event Tab in the Results Panel will contain a row for every splice event detected.
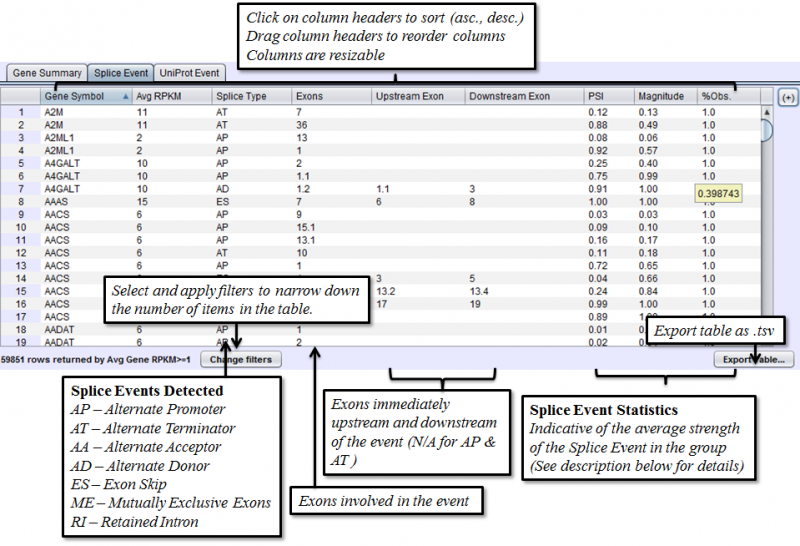
Columns that may require additonal explanation are:
- PSI - Percent-Spliced-In. Percentage of the isoforms with the included path out of all the isoforms that express the given splice event on average
- Magnitude - The proportion of isoforms which the splice event affects on average
- %Obs.: The percentage of the group expressing the given splice event. If a sample does not express a particular gene, then any event on that gene would not be observed on that sample.
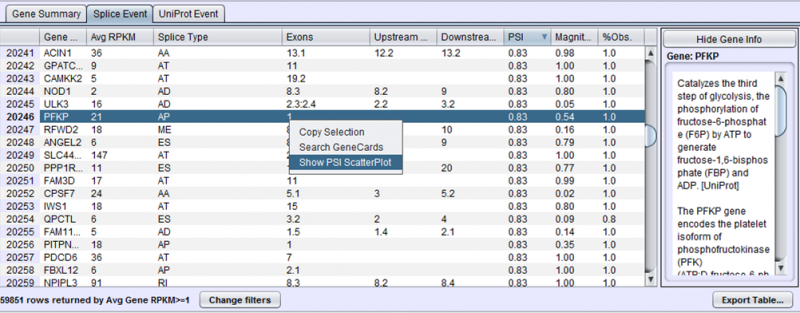
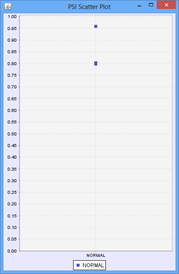
To view the scatter plot of individual sample PSIs within the group, right click on a row in the Splice Event table and choose Show PSI Scatterplot.
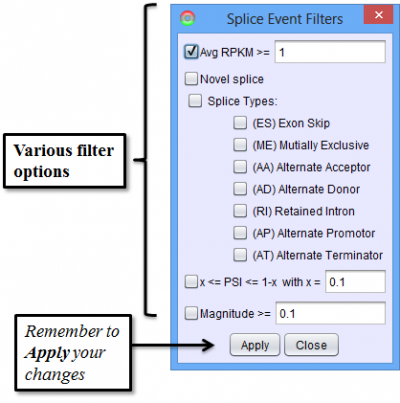
To access filtering functions for the table, use the Change filters button. The following filters are available:
Uniprot Event Tab in the Results Panel contains a row for every UniProt-annotated feature region that is affected by alternative splicing.
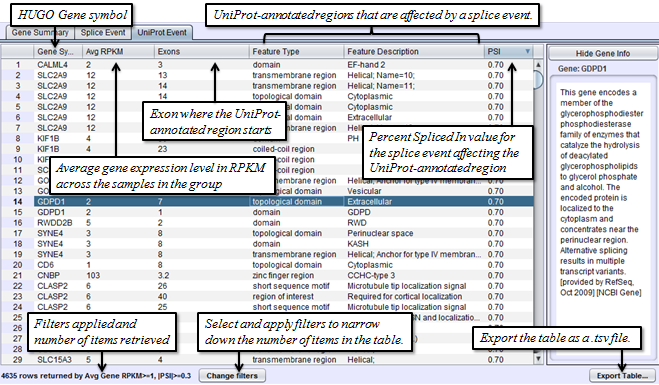
To access filtering functions for the table, use the Change filters button. The following filters are available:
Group View Detail Panel
Graph Image Tab of the Detail Panel shows how the RNASeq reads of group of samples align onto the same splice graph on average.
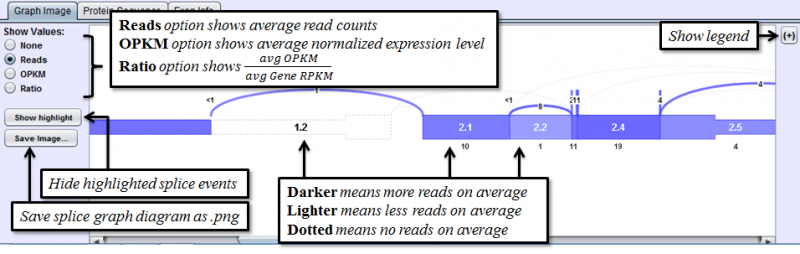
The Show Values radio buttons on the left toggles the display of numerical values for every exon and splice. There are 4 options:
- None - No numerical values are displayed
- Reads - Average total reads overlapping each exon / splice
- OPKM - average Observations Per Kilobase per Million reads for the group. (See definition of OPKM here)
- Ratio: The ratio of group average OPKM for exon / splice over average gene RPKM.
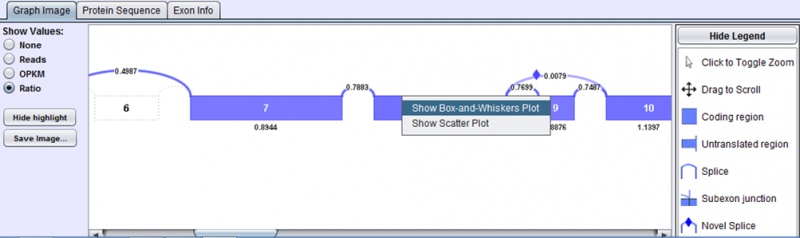
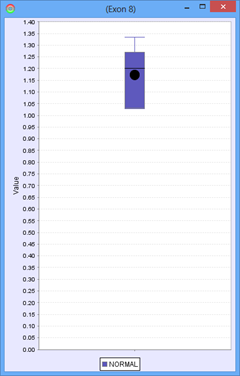
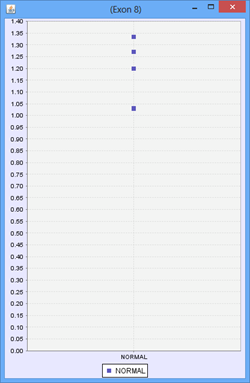
One additional feature provided in the Group View is the ability to investigate the distribution of values for any exon or splice. With OPKM, Total Reads, or Ratio selected, right click on an exon or splice line and then select either a scatter plot or box-and-whiskers plot. An additional window will open showing the OPKM, Total Read, or Ratio value for that exon / splice for each member of the group. These plots are helpful in determining if the exon or splice expression pattern is consistent across the group or widely variable.
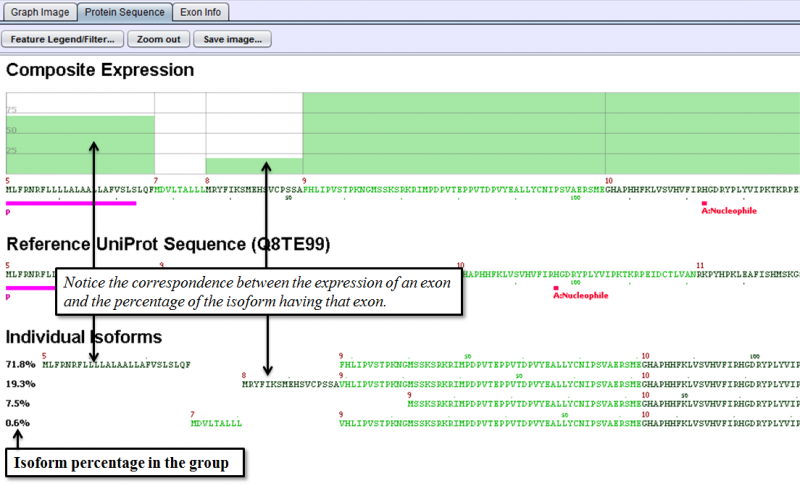
Protein Sequence Tab of the Detail Panel shows the protein sequence, functional annotation, and relative expression level of the isoforms inferred from splice patterns of the gene from the group. For basic information on this tab, refer to Protein Sequence Tab.
Exon Info Tab of the Detail Panel shows the location, properties and nucleotide sequences of each exon in the gene model. More Information can be found in the GUI Overview section.