SpliceSeq
| Overview | |
| Description | A tool for investigating alternative mRNA splicing in next generation mRNA sequence data |
| Development Information | |
| Language | Java |
| Current version | 2.1 |
| Platforms | Platform independent |
| License | Freely available for academic and commercial use |
| Status | Active |
| Last updated | February 21, 2014 |
| References | |
| Citation | Ryan, M. C., Cleland, J., Kim, R.G., Wong, W. C., Weinstein, J. N., SpliceSeq: a resource for analysis and visualization of RNA-Seq data on alternative splicing and its functional impacts, Bioinformatics 28 (18) p.2385 (2012). https://doi.org/10.1093/bioinformatics/bts452 |
| Help and Support | |
| Contact | MDACC-Bioinfo-IT-Admin@mdanderson.org |
Graphical User Interface Overview
The graphical user interface of SpliceSeq can be divided into 3 areas.
- Data Selection Bar is where View Type and Dataset are chosen.
- Results Panel is where the list of all detected Splice Events are displayed.
- Detail Panel contains visualization tools for studying specific Splice Events and their impact on protein expression.
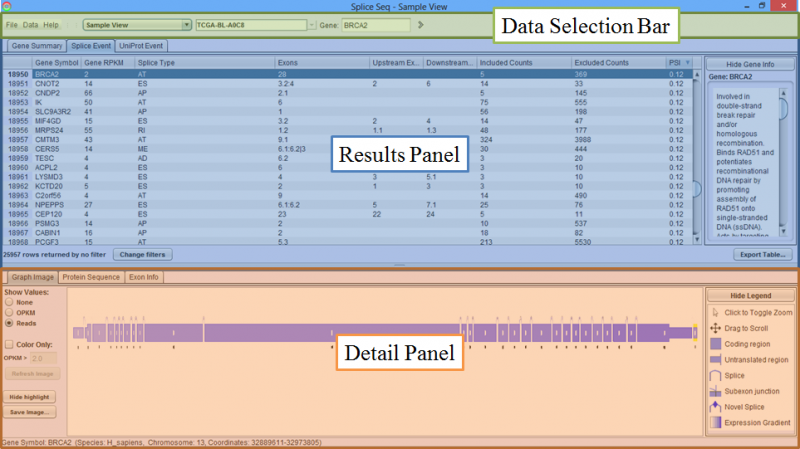
Data Selection Bar
Data Selection Bar is where the data is loaded, the View type and Dataset are chosen, as well as where the program configurations are set, and consists of the Menu, View Combobox, DataSet Combobox and Gene Finder.
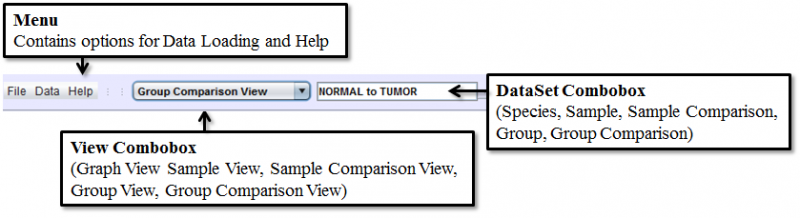
Menu contains the miscellaneous items that are functionally distinct from the other parts of the interface, and consists of 3 root level items:
- File is where the configuration Panel can be accessed
- Data is where new data can be loaded, and annotations for each sample can be viewed
- Help contains the about dialog as well as a link to the online documentation
View Combobox allows one to choose from five different view modes depending on the type of analysis you wish to explore:
- Sample View displays individual sample data
- Sample Comparison View shows the splicing differences between 2 samples
- Group View provides aggregate splicing pattern information for a group of samples
- Group Comparison View displays splicing differences between 2 groups of samples.
- Graph View is a reference view that shows splice graphs for each gene in the current SpliceSeq DB. It does not show RNASeq sample data.
DataSet Combobox is populated with relevant datasets upon selecting a view mode. Choosing an item here will populate the Results Panel with the list of detected Splice Events for the selected dataset. SpliceSeq data is organized by study so you will need to click on the appropriate study folder to see the samples / groups / comparisons in the study.
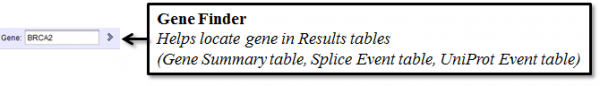
Gene Finder allows one to jump to a gene of interest in the Results Panel. Its auto-complete function will suggest possible matches when you type at least 2 letters in the text box. Clicking the arrow next to the gene symbol will go to the next occurrence of the symbol in the list. (Genes may have multiple splice events)
Results Panel
Results Panel is where the list of Splice Events for the selected sample or group are displayed.
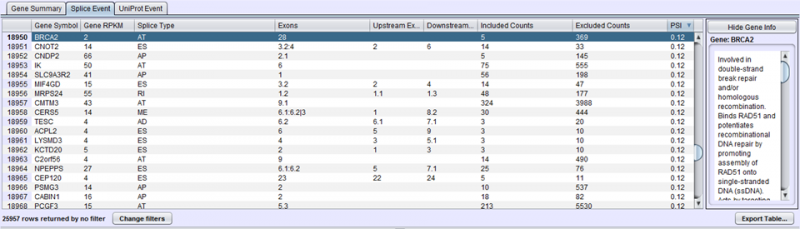
There are 3 tabs to choose from:
- Gene Summary Tab has one row per gene and provides a summary of the events found on each gene.
- Splice Event Tab has one row per splice event with detailed statistics about each splice event.
- UniProt Event Tab shows one row per UniProt event with details about the nature of the protein impact resulting from a splicing event.
Detail Panel
Detail Panel is populated with the respective splice graph and protein expression information upon choosing an item in the Results Panel. There are three tabs in the Detail Panel.
- Graph Image Tab displays the relevant Splice Graph for the chosen Gene/Splice Event/UniProt Event with expression data for each splice and exon.
- Protein Sequence Tab shows predicted isoforms resulting from the observed exon/splice expression and annotates isoforms with protein features from UniProt.
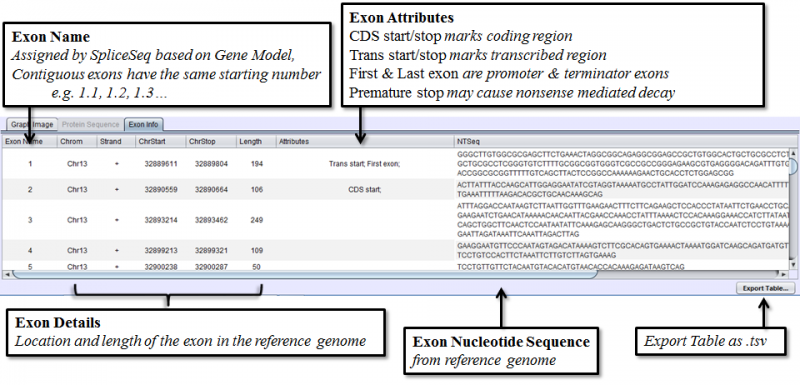
- Exon Info Tab shows the nucleotide sequence, chromosomal location, and attributes of each exon in the gene model.
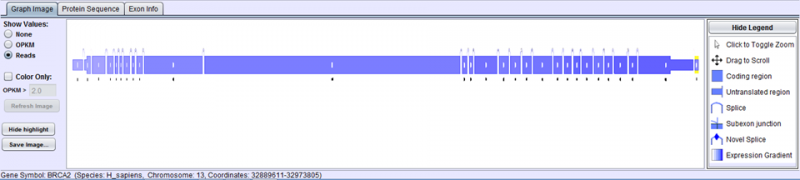
Graph Image Tab
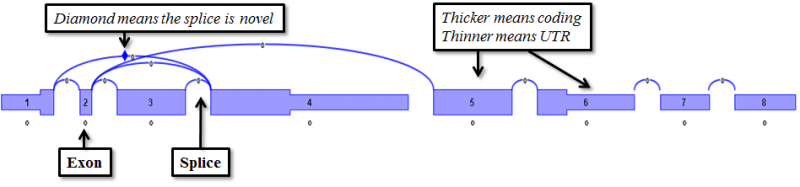
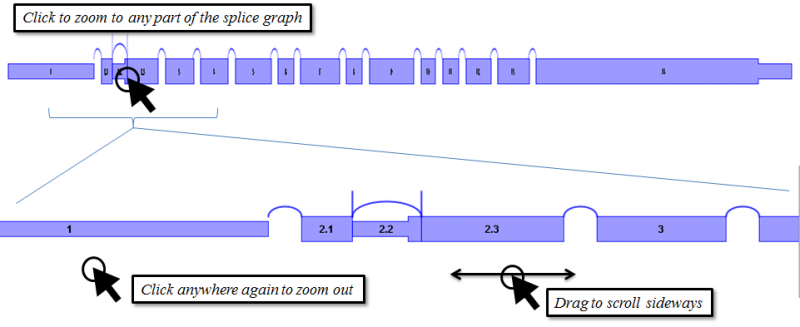
Graph Image Tab displays the splice graph of the gene with exons as boxes and arcing lines as splices.
- Exons are drawn to scale based on their nucleotide length, with thicker and thinner parts denoting coding and non-coding regions respectively.
- If an exon has alternate 5’ acceptor sites, alternate 3’ donor sites, or retained introns, the exon is split into sub-exons that will be numbered with decimal places (e.g. 3.1, 3.2, 3.3).
- There are some cases in which exons could be coding in one isoform but UTR in another. For example, when a non-constitutive exon introduces a stop codon. In such cases, if an exon is coding in any isoform path, it is drawn as coding.
- mRNA splice junctions are represented by arcs. Splice junctions marked by diamond markers are novel (not seen in the original transcript database).
- When an exon is spliced into sub-exons, short vertical lines separate adjacent sub-exons. These lines represent an ‘Internal Splices’, which are not true splices, but give totals for reads that cross between the two sub-exons.
Navigating the splice graph is done using the mouse.
- Clicking on the splice graph toggles the magnification. The entire splice graph is visible when zoomed out, while detailed information of each exon/splice junction is visible when zoomed in.
- When zoomed in, dragging will cause the diagram to scroll sideways.
- When zoomed out, click on any part of the diagram to zoom into that part
- When displaying large genes, the splicegraph will always be zoomed out initially.
- Additional information appear as tooltips when mousing over the exons and splices.
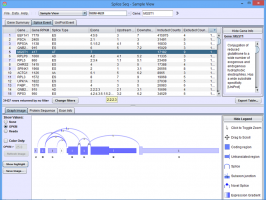
Protein Sequence Tab
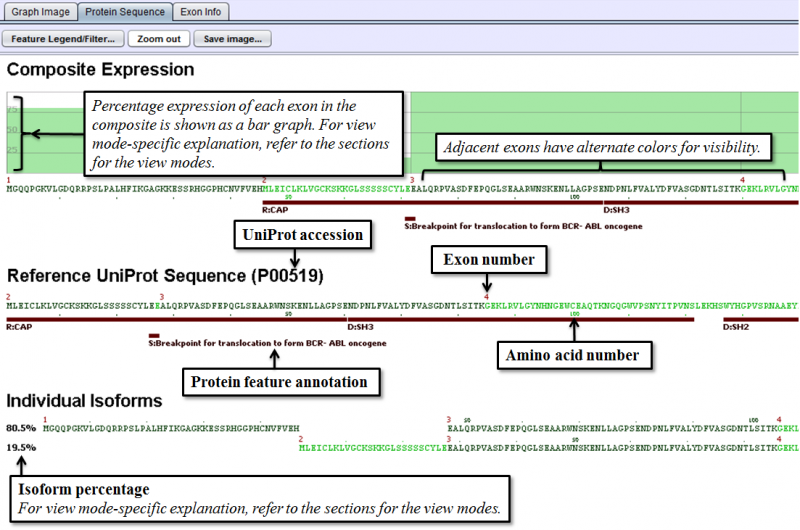
Protein Sequence Tab provides information on predicted protein isoforms based on splice graph expression, and consists of three distinct sections.
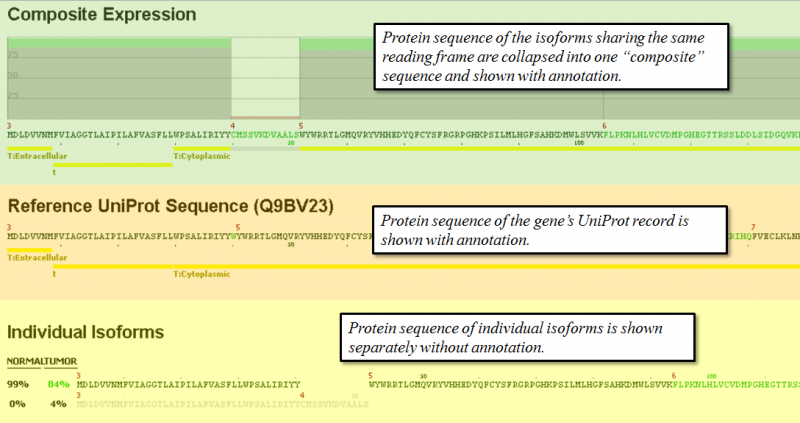
- Composite Expression section shows the exon by exon expression percentage from the combination of all expressed isoforms that share the same reading frame. Functional annotation from UniProt is shown also below the protein sequence of each composite.
- Reference UniProt Sequence section shows the canonical UniProt sequence of the chosen gene and its annotated features.
- Individual Isoforms section lists the predicted isoforms individually and provides a percentage expression of each isoform based on splice graph traversal. If an exon is spliced out of a given isoform, the sequence will be blank in the exon. The percentage values on the left of each isoform indicate the prediction of relative abundance of each isoform based on read counts of the related splice junctions. If there are broken paths in the splice graph (no path with reads from a start to stop exon), then the isoform percentages may not total 100%. In some cases, particularly when read coverage on a gene is low, it may not be possible to traverse the graph to predict protein sequence.
Detailed explanation of the tab is shown below.
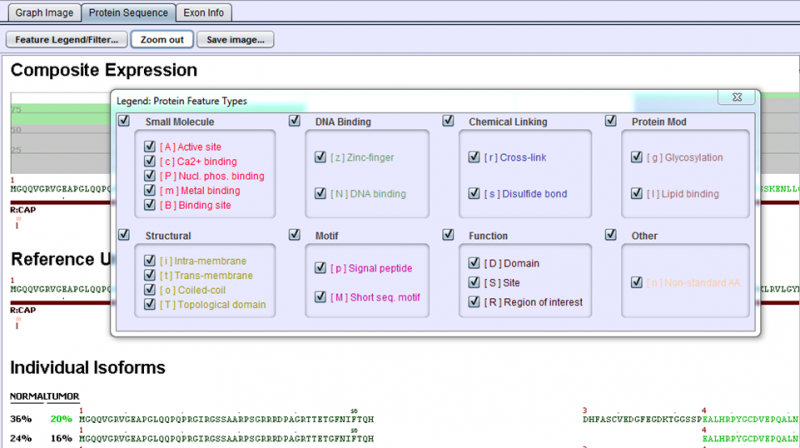
To get a fuller description of the UniProt feature codes, select the Feature Legend/Filter… button in the upper left of Protein Sequence Tab. This displays a pop-up window with the feature codes. The checkboxes in the legend may also be used to selectively turn on / off the display of various types of features. Also, Protein Sequence Tab’s image can be zoomed in and out by clicking Zoom in/Zoom out button right to Feature Legend/Filter… button. Saving the image of Protein Sequence Tab is possible by clicking Save Image… button.
Exon Info Tab
Exon Info Tab lists detailed information about each exon in the gene’s splice graph.