NG-CHM Viewer Documentation
Use the tabs below to navigate through documention about different portions of the NG-CHM interface.
The NG-CHM Viewer Application
The Next-Generation Clustered Heat Map (NG-CHM) Viewer is a web application consisting of HTML, JavaScript, and CSS that can be used in most common web browsers including Firefox, Safari and Chrome. You do not need any special plugins or other browser software installed, but you will need to have Javascript enabled. NG-CHMs can be opened online from a website or from your local file system using a local copy of the Viewer.
Existing NG-CHMs and Online Usage
Multiple websites have made hundreds of existing heatmaps available online. To see a list of such NG-CHM collections visit our web page on Existing NG-CHMs.
You do not need a local copy of the viewer to access those NG-CHMS online as the respective websites will include an online version of the viewer compatible with their map versions.
Local Viewer
If you save a copy of an NG-CHM locally or build one yourself, you’ll probably want a local copy of the NG-CHM Viewer to allow you to view those NG-CHMs.
The latest release version of the NG-CHM Viewer web application can be accessed on the NG-CHM website. This will open the viewer in your current browser and allow you to open an existing NG-CHM file from your file system. This file can also be downloaded and opened directly from your file system.
https://www.ngchm.net/Downloads/ngChmApp.html
Sample NG-CHM
The following is an example of an NG-CHM from our TCGA NG-CHM Compendium showing rnaseq data for the BRCA cancer type with genes along the rows and TCGA sample Ids along the columns. You can use this map to explore the various features described in this documentation. If you wish to view this NG-CHM in a new window while reviewing this documentation you can open this map in a new window .
User Interface Overview
The NG-CHM Viewer is a web application with a feature-rich user interface. The high-level sections of the user interface are described below.

At a high level, the NG-CHM viewer consists of two main sections, the header section and the panel section.
The Header section can be farther divided into three smaller sections as described below.
| Section | Description |
|---|---|
| Header - Map Name | The name assigned to the NG-CHM at build time. |
| Header - Search Controls | Controls for searching for matching Row and/or Column Labels on the NG-CHM. |
| Header - Main Controls | High level controls for the NG-CHM viewer. |
| Panels - Panel Area | One or more panels that display the clustered heat map and related data. |
Main Controls
The main controls at the top right of the viewer provide access to high-level controls for the NG-CHM Viewer software. Some of these controls, like the layers control will only appear if the current NG-CHM being viewed contains multiple layers of data.
| Control | Description |
|---|---|
| About Dialog | |
| NG-CHM Options Menu | |
| Heat Map Display Properties | |
| Layer Controls |
Here are details on each of the controls mentioned above.
About Dialog
The about dialog button brings up the “About” dialog box. Here you can access information about the viewer tool and project.
| Item | Description |
|---|---|
| NG-GHM Project Page | Link to this documentation. |
| New and Updates | Link to New and Update information for the NG-CHM Project. |
| Video Tutorials | Link to Video Tutorials on YouTube. |
| Version Information | Information on the current version of the software and NG-CHM. |
| Citation Information | Citation Information for use when citing the use of the NG-CHM Viewer software in a publication. |
| Tour Button | An automated tour of the various components of viewer based on the currently open map. |
| Download Viewer Button | Link to download the current version of NG-CHM Viewer that can be used to view maps locally. |
| Show Keys Button | Shows a list of the keyboard shortcuts available for navigating within the NG-CHM Viewer software. This information is also available via the Basic Navigation tab of this page. See the “Display Properties” tab on this page for detailed information. |
| Show Plugins Button | Display a dialog of the current and available plugins accessible within the viewer. This information is also available on the plugins and linkouts page on this website. |

NG-CHM Options Menu
The NG-CHM Options menu button provides access to high-level controls in the NG-CHM Viewer.
| Control | Menu Item | Description |
|---|---|---|
| Open new heat map | Allows you to open a new het map stored on your file system. | |
| Save Heat Map As PDF | Allows you to configure parameters to create a high-resolution view of the panels in the currently displayed NG-CHM and save them as a PDF file. | |
| Download Thumbnail | Download a thumbnail of the currently displayed NG-CHM. | |
| Save Heat Map Changes | Save the configuration and panel changes you have made to a local NG-CHM file that can be viewed in the NG-CHM viewer. | |
| Modify Map Preferences | Brings up the NG-CHM Heat Map Display Properties dialog which allows you to modify many of the properties of the currently viewed NG-CHM. This can also be accessed through the "Heat Map Display Properties" button. |
Heat Map Display Properties
The Heat Map Display Properties button opens up a multi-tab dialog box that provides information on the map being viewed and tabs to control many of the options used to display various aspects of the NG-CHM. Detailed information on this dialog can be found in the “Display Properties” tab of this page.
Layer Controls
If an NG-CHM has multiple layers then the Layers Control will be displayed.
When activated, then another set of controls will be displayed that will allow the user to control which NG-CHM data layer is currently displayed on the summary and detail panels in the panels section of the map. These controls include a flick control that allows the user to quickly switch between two selected layers.

| Control | Description |
|---|---|
| Layer Control Button - shows/hides the controls below. | |
| Dropdown | Flick state up layer selection. |
| Dropdown | Flick state down layer selection. |
 |
Flick control to determine which of the two layers selected above is displayed. |
Search Controls
The Search Controls allow the user to search for values in the in the row and/or column labels of the main matrix in the NG-CHM. These work in conjunction with the search navigation controls in a HeatMap Detail Panel in the panel section of the map to select and navigate through matching items in the NG-CHM data. See the Search tab in this page for more detailed information.
Panel Area
The main portion of the user interface is the panel area. An NG-CHM will display one or more panels of various types in this section. By default, NG-CHMs will have a single detail panel on the left and a summary panel on the right. See the Panel Controls section of the Advanced tab on this page to learn how to use various panel controls provided by the NG-CHM Viewer.
Details on the plugins available can be accessed via the Plug-ins tab above.
Details on the linkouts available can be accessed via the Linkouts tab above.
Details on the types of panels supported in the viewer can be accessed via the Panels tab above.
Panels
A Next-Generation Heat Map (NG-CHM) may consist of a number of panels in the interface.
Most maps will consist of a single initial Detail Panel and a Summary panel. These panels are described in more detail on the Basic Navigation tab of this page.
An NG-CHM may contain at most one summary panel, but may contain zero or more of the other panels mentioned below. Specifics on these panels will be given on pages in other tabs of this page.
Resizing bars
If multiple panels are active on an NG-CHM, between the panels will be vertical or horizontal resizing bars. By left-clicking on these bars and holding down the left mouse button while draging on these resizing bars, the relative sizes of the panels on either side of the resizing bar can be changed.
Panel Header
All panels include some common elements included in the header section at the top of the panel. Some panel headers will contain extra controls which will be described in the entries for the individual panel types.

The common header elements include (from left to right in image above):
| Element | Description |
|---|---|
| Expand / Contract Panel Button | Pressing the Expand Panel will hide all other panels and expand the panel to take up the entire panel area of the Viewer. Once expanded this button will switch to the Contract Panel button which will switch the display back to the normal proportion of space taken by the panel in the panel area. |
| Title | Title text describing the panel type. |
| Panel Menu Button | Opens a menu Menu for the panel. See information below for additional details. |
Panel Menu
The panel menu button mentioned above will allow the user to control the panel type of each panel and allow the user to open and close panels. The menu is divided into two sections, "Set Content to" and "Panel Control"

Menu Options
| Section | Option | Description |
|---|---|---|
| Set Content to | Linkouts | Sets the panel to be an area for Linkout content to be displayed. The last panel set to be a Linkout panel will be set to the contents of the next linkout used if there is more than one open Linkout panel and the Linkout type can be displayed in this panel. |
| Set Content to | Detail heatmap | Sets the panel to be a Detail heatmap panel. There can be more than one of this panel open in the panels area. See the Basic Navigation tab for more information on this panel. |
| Set Content to | Summary heatmap | Sets the panel to be a Summary heatmap panel. There can only be at most one of this panel type open in the panels area. If there is a panel of this type open and a new panel is set to this type, the former Summary Panel contents will be set to be an empty panel. See the Basic Navigation tab for more information on this panel. |
| Set Content to | 2D Scatterplot | Set the contents of this panel to be a UMAP / 2D Scatterplot plug-in panel. The panel configuration dialog will automatically open in the panel to allow setting the initial configuration of the panel. See the Plug-ins tab for more information on this panel. |
| Set Content to | 3D Scatterplot | Set the contents of this panle to be a 3D Scatterplot plug-in panel. The panel configuration dialog will automatically open in the panel to allow setting the initial configuration of the panel. See the Plug-ins tab for more information on this panel. |
| Set Content to | PathwayMapper | Set the contents of this panle to be a PathwayMapper plug-in panel. The panel configuration dialog will automatically open in the panel to allow setting the initial configuration of the panel. See the Plug-ins tab for more information on this panel. |
| Panel Control | Add Panel Below | Split the current panel vertically into two equally sized panels and set the lower one to an empty panel. |
| Panel Control | Add Panel Right | Split the current panel horizontally into two equally sized panels and set the lower one to an empty panel. |
| Panel Control | Collapse / Uncollapse | Selecting the Collapse option will hide all of the contents of the panel except the header section containing a menu button. The Collapse option in that menu will be replaced with an Uncollapse option which will cause the panel to be fully displayed at it’s previous relative size. Ths allows another panels in the section more display space without removing the collapsed panel completely. |
| Panel Control | Close | Closes the panel. This will cause other panels to resize to take up the other space in the panel section that was being used by the closed panel. Any configuration settings for a plug-in panel will be lost when closed. |
| Panel Control | Tour | Shows a detailed tour of the contents of that panel to the limits that such a tour is available. |
Available Panels Types
| Sample Image | Panel Type | Description |
|---|---|---|
| Empty Panel | This is the default for a newly created panel. Select a panel type using the panel menu button described above. | |
 |
Summary Panel | A summary panel displays a map of all the data in the main matrix, related dendrograms covariates, and axis labels, and top items. It is used to display a summary of the data on the NG-CHM and help select what information is being displayed on detail panels. Display of the summary panel is optional and there can be only one summary panel in the panels area. See the Basic Navigation tab for more information on this panel. |
 |
Detail Panel | A detail panel displays a section the overall data in the Summary panel. It can be zoomed into and out of and be used to select data in the NG-CHM to be used in other panels. See the Basic Navigation tab for more information on this panel. |
 |
UMAP / 2D ScatterPlot Panel | A Uniform Manifold Approximation and Projection (UMAP) / 2 dimensional scatterplot of selected data in the NG-CHM. See the Plug-ins tab for more information on this panel. |
 |
3D ScatterPlot Panel | A 3 dimensional scatterplot of selected data in the NG-CHM. See the Plug-ins tab for more information on this panel. |
 |
PathwayMapper Panel | A plug-in that allows viewing of pathway maps within the visual interface and values within the map that match the nodes in the pathway map. See the Plug-ins tab for more information on this panel. |
 |
Linkouts Panel | A panel for displaying selected data on the NG-CHM on a subset of the linkouts to other websites that are available in the NG-CHM. Some website linkouts can only be opened in separate tabs. The image to the left shows the selected data as displayed by the link out to the MD Anderson Ideogram Viewer. See the Linkouts tab for more information on this panel. |
Navigation
Detail and Summary Panels
In addition to the header area described in the Interface Overview tab, an NG-CHM will typically consist of at least two panels, a summary panel and a detail panel. These panels are divided into several major display and interaction areas as detailed below.

The Summary panel (right panel) displays a summarized view of all the data of a layer in the NG-CHM and can be used to select which data is displayed in Detail Matrix panels (left).
Both of these panels display a main matrix and optionally covariates and dendrograms for both rows and columns. In addition a detail panel will display row and column labels for both the main matrix and for covariates if space is available at the current zoom level.
Summary Panel
The summary panel always displays all of the matrix data in the selected layer of the NG-CHM. If this data matrix consists of more rows or columns than there are pixels available to display it, then the data will be summarized using one of a few options and therefore might display colors different from those defined in the map dependent on the summarization method and colors the builder of the map selected when they created the map.
In addition to providing this summarized view of the current layer this panel has other functionality:
- Indicates what rows/columns/areas are selected on the NG-CHM.
- Displays boxes around the areas that are displayed in all detail panels to indicate what parts of the map are being displayed in those detail panels.
- Displays top items defined for the NG-CHM, if any are defined.
Allows modification of the selection of data to be displayed in the current primary detail pane through several methods to be described below.
- Clicking on the main matrix area to move the current detail panel to a new part of the matrix.
- Clicking and dragging on the main matrix area to move the current detail panel to a new part of the matrix.
- Drag-and-Drop selection on the main matrix area of the summary pane to select a non-proportional detail matrix area.
- Clicking on the row and/or column dendrogram areas in the summary pane to select or deselect areas.
- Increasing or descreasing the size of the box displayed in the current detail panel using the mouse wheel.
Navigation operations: The following operations are available when the cursor is on the summary panel area:
| Operation | Description |
|---|---|
| Zoom In | Click to zoom in, or use the scroll-wheel on your mouse. |
| Zoom Out | Shift and click to zoom out, or use the scroll-wheel on your mouse. |
| Pan | Drag this area to move side-to-side. |
| Stretch Horizontally | Control-right-arrow (hold down the control key while pressing the right arrow key) will make each data point wider. |
| Squeeze Horizontally | Control-left-arrow will make each data point narrower. |
| Stretch Vertically | Control-up-arrow will make each data point taller. |
| Squeeze Vertically | Control-down-arrow will make each data point shorter. |
As you move around, the dendrograms, classifications, and labels will also move around to stay in sync with the central heat map display.
Other operations:
- Matrix Menu:
- Right click (Control-click on a Mac) on the main data area to bring up the matrix menu. This menu will include operations based on the selected rows and columns or the current row and column of the matrix if none were selected.
- Shift Drag over the main matrix area to select rows and columns. Rows and columns can also be selected through the corresponding dendrograms and labels. The options available in the menu are determined when the CHM was constructed.
Dendrograms
Dendrograms, if present, will appear on the top or left. Click a branch to select a branch. Shift-click on a branch to add or remove it from the current selections. The detailed elements of the dendrogram may be replaced by a solid bar if they are too small to be displayed. This bar may be shown in an alternate color to indicate that the dendrogram was trimmed at that point. As you zoom in, the dendrogram will increase in size and additional details will be included. Selecting a dedrogram region on the summary panel will set the primary detail panel view into horizontal or vertical ribbon mode dependent on the axis selected. See the Detail Panel description below for more details.
Covariate Bars
Covariate bars, if present, will appear between the dendrogram (if present) and the central heat map display.
Axis Labels
Axis labels are displayed once the image has been zoomed in enough for them to be legible. Right-click (Control-click on a Mac) on the label area to bring up the label menu. The menu will be based on the selected labels. Click a label to select a label. Shift-click to add or remove a label from the current selections. You can also shift and drag over the labels to select them, even if the map is not zoomed in enough to display the labels. The options available in the menu are specified when the NG-CHM is constructed.
Top Items
If top items for rows or columns have been defined for the NG-CHM, then they will appear below or to the right of the main matrix respectively.
Making selections in the Summary Panel
Selection operations performed on the Summary Panel will not select rows and columns on the detail view, but will instead select the view shown in the Detail Panel. The Detail Panel will select the closest matching zoom level for the region you wish to view.
Selections on this panel can be made in mutiple ways.
– Clicking on the main matrix area. – Use shift and hold down the left mouse button while dragging the mouse pointer across the main matrix area. – Clicking or shift-clicking on a dendrogram.
For clustered heat maps, a selection option in the Summary Panel can be used to view a section of the map associated with a dendrogram branch. This feature is particularly useful for investigation of sub-sections of the heat map related class of samples (e.g. subgroup of cancer patients identified by a dendrogram branch). Selecting a dendrogram branch in the Summary Panel will lock the Detail Panel to only portion of the heat map associated with the selected branch of the dendrogram. The selected portion of the map is visible as it normally is in the Summary Panel but the non-selected part of the heat map is grayed out. You can scroll up/down or left/right through dendrogram branch data in the Detail Panel. This view is essentially a restricted ribbon view. To get out of the sub-dendrogram view, click on the normal mode button in the primary detail panel.

Detail Panel
Detail Panels are where the most detailed view of the data is available and where many of the user interactions with data in the NG-CHM will occur. A detail panel will display some subset of the data in the matrix.
Like the summary panel, if the visible detail matrix consists of more rows or columns than there are pixels available to display it, then the data will be summarized using one of a few options and therefore might display colors different from those defined in the map dependent on the summarization method and colors the builder of the map selected when they created the map.
Detail Panel Header
The header area for a detail panel, in addition to the standard elements contained in all panel headers as described in the Panels tab will include additional controls for search navigation, zooming, and ribbon mode controls as displayed and described below. For more information on search-oriented functions mebtioned below, see the Search tab on this page.
Here is an example of the detail panel header for the Primary Detail panel with the search mode in both axes and in the both axis normal view versus one of the ribbon views. More information about the various icons and their relation to these settings can be found in the table below.

| Control | Menu Item | Description |
|---|---|---|
| / | Expand / Collapse Panel | Pressing the Expand Panel will hide all other panels and expand the panel to take up the entire panel area of the Viewer. Once expanded this button will switch to the Contract Panel button which will switch the display back to the normal proportion of space taken by the panel in the panel area. |
| Text | Panel Title | Title text describing the panel as a Heat Map Detail panel. |
| Primary Detail Panel Button | Button to make a detail panel the primary (active) detail panel. The background will be green for the primary panel and grey for non-primary detail panels. Actions performed on the summary panel will only affect the primary detail panel. | |
| Left Arrow | Search / Move the detail view to the previous selected item along the column labels. | |
| Right Arrow | Search / Move the detail view to the next selected item along the column labels. | |
| Up Arrow | Search / Move the detail view to the previous selected item along the row labels. | |
| Down Arrow | Search / Move the detail view to the next selected item along the row labels. | |
| Both Axis Search | Search / Move among labels along both axes. | |
| Vertical Axis Search | Search / Move among labels only along the vertical axis (rows). | |
| Horizontal Axis Search | Search / Move among labels only along the horizontal axis (columns). | |
| Zoom Out | Zoom out on the heat map display. | |
| Zoom In | Zoom out on the heat map display. | |
| Normal View | The detail view can be panned along both axes. The current mode for the detail panel will have a green background. | |
| Horizontal Ribbon Mode | Panning and zooming in the detail view is restricted to left and right. The current mode for the detail panel will have a green background. | |
| Vertical Ribbon Mode | Panning and zooming in the detail view is restricted to up or down. The current mode for the detail panel will have a green background. | |
| Panel Menu Button | The panel menu button. For a detailed description of the menu option, see the Panels tab. |
Axis Labels
While row and column matrix labels are never displayed on the summary panel, whether or not they are displayed in a detail panel depends on the screen space avaiable in the browser for a specific detail panel.
Making Selection on the Detail Panel
Selecting rows and/or columns in the heat map is useful because operations like copy to clipboard or link out functions may be performed on selections.
There is only one set of selections for an NG-CHM. All detail panels and plug-in panels will reflect this single set of selected data.
Rows or columns can be selected through a search or may be selected by clicking on a row or column label. To select multiple labels use shift-click to select a block of labels or control-click to individually select multiple labels. When labels are selected, you can right click on one of them to access a pop-up menu of actions that can be performed on the selected labels. For advanced maps, a variety of context specific link out options may be available.
Drag selection is also possible. On the Detail Panel hold down shift and the left mouse button while dragging the mouse pointer across the rows and columns you wish to select. Matrix data specific link out functions can be accessed by right clicking on the resulting green selection box in the Detail Panel.

Keystroke Shortcuts
In addition to using the mouse as described above, some keystroke shortcuts are available for controlling aspects of the summary and detail panels.
| Key | Action | Description |
|---|---|---|
| ArrowLeft | MoveLeftOne | Move the selected area in the primary detail panel one column left. No effect if currently in vertical ribbon mode. |
| ArrowRight | MoveRightOne | Move the selected area in the primary detail panel one column right. No effect if currently in vertical ribbon mode. |
| ArrowUp | MoveUpOne | Move the selected area in the primary detail panel one column up. No effect if currently in horizontal ribbon mode. |
| ArrowDown | MoveDownOne | Move the selected area in the primary detail panel one column down. No effect if currently in horizontal ribbon mode. |
| Shift-ArrowLeft | MoveLeftPage | Move the selected area in the primary detail panel to the right by the number of cells displayed in the detail panel (one page). No effect if currently in vertical ribbon mode. |
| Shift-ArrowRight | MoveRightPage | Move the selected area in the primary detail panel to the right by the number of cells displayed in the detail panel (one page). No effect if currently in vertical ribbon mode. |
| Shift-ArrowUp | MoveUpPage | Move the selected area in the primary detail panel up by the number of cells displayed in the detail panel (one page). No effect if currently in horizontal ribbon mode. |
| Shift-ArrowDown | MoveDownPage | Move the selected area in the primary detail panel down by the number of cells displayed in the detail panel (one page). No effect if currently in horizontal ribbon mode. |
| Ctrl-ArrowLeft | MoveRibbonLeft | If in vertical ribbon mode, move ribbon area one column to the left. If not in vertical ribbon mode, same effect as ArrowLeft. |
| Ctrl-ArrowRight | MoveRibbonRight | If in vertical ribbon mode, move ribbon area one column to the right. If not in vertical ribbon mode, same effect as ArrowRight. |
| Ctrl-ArrowUp | MoveRibbonUp | If in horizontal ribbon mode, move ribbon area one column up.If not in horizontal ribbon mode, same effect as ArrowUp. |
| Ctrl-ArrowDown | MoveRibbonDown | If in horizontal ribbon mode, move ribbon area one column down. If not in horizontal ribbon mode, same effect as ArrowDown. |
| PageUp | ZoomIn | Zoom the primary detail view in one step. |
| PageDown | ZoomOut | Zoom the primary detail view out one step. |
| Shift-PageUp | ChangeZoomModeLeft | Change zoom modes: vertical ribbon -> horizontal ribbon -> normal |
| Shift-PageDown | ChangeZoomModeRight | Change zoom modes: normal -> horizontal ribbon -> vertical ribbon |
| F2 | ToggleLayers | Toggle between the two selected layers. |
Search
As mentioned in the section on the NG-CHM header area on the Interface Overview tab, the NG-CHM Viewer includes capabilities to search for data in the map.
Data can be searched for and selected among the row and column labels or among the values of covariates along either or both axes. When a search is done, the matching data replaces the currently selected data on the NG-CHM. ## Search Controls The search controls on the toolbar are displayed below.

The controls are described below.
| Search Control | Description |
|---|---|
| Search Target | Dropdown that allows you to select “Labels” or any of the Covariates on the NG-CHM. The default is to search the labels on the main matrix. |
| Search Text | Text field for manually entering text to search for or a dropdown of values to select from. See the section on “Search Text” below for additional information. |
| Axis Selector | Dropdown to tell whether you wish to search rows, columns, or both for the matches. If only one of rows or columns is selected then only the selected items along that axis will be replaced by the search results. If a covariate is selected in the Search Target dropdown, then this field will automatically be set to the axis associated with the selected covariate. |
| Go Button | Perform the search. This can also be done by hitting the Enter key in the Search Text control. |
| Red X | Clear search selections button. This will clear the search selections and deselect any items selected by the search function along the axis specified in the Axis Selector control. |
Search Text
The Search Text control works differently dependent on the selections made for Search Target control.
| Search Target Type | Search Text Behavior |
|---|---|
| Labels | The Search Text field will be a text box that uses a variety of regular expressions to search for matches among the rown and column labels of the main matrix of the NG-CHM. The search will find labels that partially match the search text. To find exact matches only, put double-quote characters around the search term. Multiple search terms can be separated by spaces.For example: Search: Gene_2 will find rows Gene_2, Gene_21, Gene_283, etc. Search: “Gene_2” will find only the row Gene_2 |
| Continuous Covariate | If the Search Target field is set to a Covariate with continuous values, then the Search Text will be a text box that will accept search expressions. Search expressions should be entered in the form of a comma-delimited string with each segment representing an expression. Valid expressions would include individual numeric values, values preceded by one of the following operators: >, >=< <, <= (e.g. >10), and/or range expressions with 2 operators creating a range of values (e.g.>10<=20). Expressions that do not match these patterns will be ignored. |
| Discrete Covaraite | If the Search Target field is set to a Covariate with discrete values, then the Search Text will be a multi-select list of the values that that covariate can have in the NG-CHM. Each item in the list will include a checkbox and all covariate rows or columns (dependent on location of covariate) that match the selected values will be selected on the NG-CHM. |
Search Results
If the search box turns red, none of the search terms were found. If it turns yellow, only some of the search terms were found.
All rows and/or columns, as specified by the Axis Selector will be selected in the NG-CHM. This will affect the selection of rows and/or columns on all panes of the NG-CHM.
The labels of rows and columns that match the search term will be selected (green background) and a green highlight will be displayed in the margin of Summary Panel at the position of matching rows/columns. See the selection color entry on Display Properties tab to change the selection color.
NG-CHM Heat Map Display Properties
The Heat Map Display Properties dialog box, accessed via the gear button in the main controls at the top right of the NG-CHM viewer can be used to review and change many of the visual properties of the NG-CHM you are viewing.

This dialog consists of three sections, the header, the tab, and footer areas.
The Header Area
The header area contains a docking button used to dock the dialog to the left or right side of the browser window, the dialog title, and a close button. The dialog can be moved to a different location within the browser screen by clicking on the header region and dragging the box to the new location.
The Footer Area
The footer area contains three buttons with the following functionality.
| Button | Function |
|---|---|
| Apply | Applies any changes you have made on any of the tabs to the current NG-CHM. |
| Reset | Reverts any changes you have made on any of the tabs to the last applied set of changes. |
| Close | Closes the dialog box. |
The Tab Area
The tab area consists of four tabs, as described below.
| Tab | Function |
|---|---|
| Map Info | Displays general information about the data in the NG-CHM. |
| Heat Map Colors | View and set breakpoints and colors of the main matrix for each layer of the NG-CHM. |
| Rows & Cols | View information about the rows and columns of the NG-CHM, the type of data on each axis, and how the items on the axes are clustered. Provides axis-level controls for axis-related items on the NG-CHM. |
| Covariate Bars | View the names of and control the visibility and height of each covariate that is part of the NG-CHM. |
The Map Info Tab
The Map Info tab displays general information about the NG-CHM as a whole.

| Section | Field | Description |
|---|---|---|
| About | Name | The name of the map as set by the builder at build time. |
| Size | The number of rows and columns in the NG-CHM. | |
| Description | The description of the NG-CHM as set by the builder. | |
| Build Time | When this NG-CHM was created by some NG-CHM builder software. Note that this is the time the original map was built. If you make and save changes to the a local copy of the file this date will still represent the day the original NG-CHM was built. | |
| Read Only | If the NG-CHM has been downloaded from a server, this field tells whether saving changes you have made to the NG-CHM will update the version on the server as well. If this is a local copy of a map or saving the map to the server is allowed, then the map will not be Read Only and the value will be N. If you are not allowed to save the map back to a server then the value will be Y. | |
| Versions | Viewer Version | The version of the NG-CHM viewer currently being used to view the NG-CHM. |
| Map Version | When major revisions to the underlying architecture of NG-CHMs are made, a new “Map Version” is created. This field tells that version number. This is independent of the NG-CHM Viewer version used to view the NG-CHM. | |
| Builder Version | The software name and the version number of the software the Builder software that was used to create this NG-CHM. | |
| Layers | dl1 | A list of names and values of main matrix layers in the displayed NG-CHM. All NG-CHMs will have at least one layer. |
| dl2 | A list of names and values of main matrix layers in the displayed NG-CHM. All NG-CHMs will have at least one layer. | |
| Attributes | A list of names and values of additional attributes assigned to the NG-CHM by the builder. These are used to provide extra storage for information the map builder may want to have tracked with the NG-CHM that isn’t otherwise automatically tracked by the NG-CHM viewer software. |
The Heat Map Colors Tab
The Heat Map Colors tab allows you to view and set the breakpoints and colors used to display the main matrices of each layer of the NG-CHM.

| Section | Field | Description |
|---|---|---|
| Data Layers | Data Layer | Dropdown that allows you to select which layer in the NG-CHM the remainder of the controls on the tab refer to. |
| Breakpoints | View and set at what colors are assigned to the values of the main matrix for the selected layer of the NG-CHM. The controls allow addition and deletion of breakpoints. There must be two or more breakpoints for any NG-CHM. Breakpoint values can not be duplicated and must be listed in ascending order. Values appearing between two breakpoints will appear as a linear average of the Red, Blue, and Green components of the colors that are assigned to the breakpoints on either side of that value. The first and last breakpoint colors will be assigned to all values before the first breakpoint or after the last brakpoint respectively. | |
| Breakpoint | The value at which a new color will be assigned. | |
| Color | The color that will be assigned at that value. | |
| + button | Add a new breakpoint below the + button, i.e. after that breakpoint. If you wish to add a new breakpoint before the first one, you’ll need to add one after the first item and manually copy the breakpoint value from the first to the new breakpoint value and then change the first one to the new value. | |
| x button | Delete the breakpoint value and associated color to the left of the x button. | |
| Missing Color | Missing Color | The color of all cells on the main matrix of the current layer if that value is missingis missing, i.e. has a value of N/A. |
| Palettes | Palettes will change all of the colors of the breakpoints to match those defined in the specific palette. The number of breakpoints and their values will not change. If there are more colors in the palettes than there are breakpoints defined, the first colors of the palette will be used until there are no more breakpoints. If there are fewer colors in the palette than breakpoints then a linear combination of the colors in the palette based on the breakpoint values provided will be calculated to fill out the provided breakpoints. Not this may mean that some colors of the palette will never actually appear in the NG-CHM. For example if You have 5 endpoints but they are not symmetrical around the middle one and you choose the red whit and blue palette, then pure white may never be assigned to any breakpoint. | |
| Blue Red palette button | Sets the breakpoint colors to red for low values, white in the middle, and blue for high values. The missing color is set to black. | |
| Rainbow palette button | Sets the breakpoint colors to use a continous rainbow of colors across the end points defined in the NG-CHM. The lowest value will be set to red and the highest to violet and the others will be set to various colors between dependent on the number of breakpoints that were defined. The missing color is set to black. | |
| Green Red palette button | Sets the breakpoint colors to green for low values, black in the middle, and red for high values. The missing color is set to white. | |
| Grid | Grid Lines | Sets the color of the grid lines displayed between cells if grid lines are displayed. |
| Grid Show | Checkbox to set whether grid lines are displayed between cells or not. If checked grid lines will be drawn between the cells on the NG-CHM. | |
| Other Colors | Selection Color | Sets the color that will be used to display the boxes surrounding the selected cells and the background color of the selected labels in any visible summary and detail panels on the NG-CHM. |
| Gap Color | If the NG-CHM has beed designed to have gaps between rows to separate portions of the, this setting determines the color of the gap regions. | |
| Histogram | Update button | This button updates the histogram that appears below it to the colors you have selected for the NG-CHM to see the current color settings even if you haven’t yet applied the changes to the actual NG-CHM. |
| Histogram | This displays a histogram of the values of the main matrix of the selected data layer and displays how the chosen colors will be applied to those values. |
The Rows And Cols Tab
The Rows And Cols tab allows you to view information about the clustering of the rows and columns on the NG-CHM and configure some of the visual components of the rows and columns of the NG-CHM.

| Section | Field | Description |
|---|---|---|
| Row Information | ||
| Total Rows | Count of the number of rows in the heat map. | |
| Labels Type | Describes the type of data represented by the row and identified by the row label (e.g. Gene Symbol). In advanced maps there can be additional row level metadata which is not displayed. If so these will be shown in this field separated by commas. | |
| Ordering Method | The method used to order the rows in the heat map. Currently can be: hierarchical clustering, original order, or random. | |
| Agglomeration Method | This is applicable only when rows are ordered by hierarchical clustering and describes the algorithm used for clustering. The currently supported methods are: Average Linkage, Complete Linkage, Single Linkage, Ward, Mcquitty, Median, or Centroid. (Note: the NGCHM R package supports all of these; however the online GUI builder does not support Median or Centroid) | |
| Distance Metric | This is applicable only when rows are ordered by hierarchical clustering and describes the metric used to calculate the distance between any two rows. The currently supported metrics are: euclidean, binary, manhattan, maximum, canberra, minkowski, or correlation. | |
| Show Dendrogram | For maps with hierarchical clustering, may be configured to hide/show the dendrogram for rows in the summary panel and/or the detail panel. | |
| Dendrogram Height | Use the dropdown to increase or decrease the amount of space used in the Summary and Detail view for the dendrogram. Increasing the size of the dendrogram will decrease the space available for heat map values and vice-versa. | |
| Maximum Length | Labels may need to be trimmed in the Detail Panel display. This values allows you to increase/decrease the truncation point for labels. Longer labels will leave less room for display of the other heat map elements. | |
| Trim Text From | If labels need to be trimmed, this option sets the method to use to shorten the strings: trim the beginning, remove characters from the middle, or truncate. | |
| Top Columns | Certain rows may be designated as top columns on the NG-CHM. These will be highlighted on the Summary Panel by having the label displayed and a line drawn to the corresponding row in NG-CHM. To designate the rows to be displayed in this manner, enter the label names separated by either commas or carriage returns. Up to ten top items can be displayed on an axis. If more than ten are designated then some will not be displayed. If the labels do not exist on the axis, the wrong separator is used, or more than 10 labels are specified, there will not be notification that this occurred beyond that problematic top items will not be displayed on that axis. | |
| Column Information | The same fields as listed above for rows but applied to columns. |
The Covariate Bars Tab
The Covariate Bars tab allows you to control the visibility and display height for rows or display width for columns of the covariates that are included in the NG-CHM. It also allows you to adjust the colors of the items in each covariate.
At the top of this tab are controls that allow you to filter the list of covariates that will be displayed in the Covariate Bar dropdown below it. This allows you to limit the covariates listed by partial names in case there is a long list. If a filter is applied then the "Filter Covariates" button will change to "Remove Filter" to allow you to revert back to the full list of covariates.
Below that is the Covariate Bar dropdown that change to one of three layouts dependent on the selection made in the dropdown.
Covariate Bar selection - ALL
The default for the value is "ALL". If that option is selected, the layout will display a list of all the covariates defined in the NG-CHM or all of those that have labels that match the filter criteria if one is set.

For each of the displayed covariates the following information will be displayed.
| Field | Description |
|---|---|
| Covariate Name | The name of the covariate assigned when the NG-CHM was built. Note: Names of covariates can be the same across axes but will be unique within one axis. |
| Position | The axis on which the covariate appears. Row or Col. |
| Show | Checkbox to set visibility of axis. Checked indicates that the covariate will be displayed on the NG-CHM in any visible Summary or Detail panel. The values of all covariates are available for use in other panels such as Scatterplot panels. |
| Height | The height of a row covariate or the width of a column covariate. Note that these values generally relate to number of pixels, but if there are a large number of visible covariates compared to the total area for a panel, they may scaled to less than one pixel and used as relative heights within the axis region that displays covariates. |
Above the controls for individual rows are controls to change values for all the currently displayed covariates according to the current filter settings.
There is a show checkbox that will set all the currently covariates to be displayed or hidden. There are also + and - buttons to adjust the height/width of all the filtered covariates up or down one unit at a time.
Covariate Bar selection - One discrete covariate

| Field | Description |
|---|---|
| Bar Position | Row |
| Color Type | |
| Bar Type | “Color Bar” is the only Bart Type option for discrete covariates. |
| Category | For each distinct discrete label in the covariate there will be a row showing the label of that distinct value. |
| Color | For each category there will a color control that will allow you to specify the color to display in the covariate bar for any items that have the associated category. |
| Missing Color | The color to use for missing (N/A) values in a covariate. |
| Palettes | Multiple pre-defined color palettes may be available to apply colors to the categories. |
Covariate Bar selection - One continuously-valued covariate
If the selected covariate is a continuous covariate then the tab will display informantion as shown below.
Bar Position specifies the axis this covarite is associated with. Color Type specifies that this is a covariate with real numbered continuous values rather than discrete values.
Bar Type determines how to display the continuous points in the covariate. There are three options, Color Bar, Bar Plot, and Scatterplot, each with distinct configuration settings as described below.
Example of each Bar Type
Note that the column covariates will be displayed similarly but rotated 90 degrees counter-clockwise so the "bottom" in those cases would be the right side of the covariate and the "top" would be to the left.
| Bar Type | Sample Row Covariate Image |
|---|---|
| Bar Plot |  |
| Color Plot |  |
| Scatter Plot |  |
Color Bar Style Covariates
For the color bar style, the rest of the values are for defining the breakpoints and associated colors for the values of this covariate. These work similarly to the controls for the breakpoints for the main matrix layers described in the "Heat Map Colors" tab description above, but apply to the selected covariate covariate. The palette choices are different from those in the main matrix area, but work similarly.

Bar Plot Style Covariates
The bar plot style covariate allow you select lower and upper bounds for the range of values to be displayed on the covariate bar. It also allows you to set the foreground and background colors of the covariate. A solid bar of the background color will be drawn and then a solid will be drawn using the foreground color from the bottom of the covariate to the appropriate height in the covariate. If the value for the covariate is higher than the specified upper bound then a solid bar will be drawn in the foreground color from the bottom to the top of the covariate.

Scatterplot Style Covariates
The scatter plot style covariate allow you select lower and upper bounds for the range of values to be displayed on the covariate bar. It also allows you to set the foreground and background colors of the covariate. A solid bar of the background color will be drawn and then points will be drawn using the foreground color at the appropriate height. If the value for the covariate is lower or higher than the specified ranges then a point will be drawn at the bottom or top of the covariate area instead.

Plug-ins
The NG-CHM Viewer includes in its architecture a mechanisms for defining plug-ins that allow new panel types to be defined that can interact with other panels in the NG-CHM. These plug-ins can enable acces to tools that can help to better understand and explain the data in the NG-CHMs.
Plug-ins
As mentioned in the panels description of the panel area of the Panels tab, the plug-ins currently supported in the NG-CHM Viewer that are available on the ngchm.net website include The "UMAP / 2D ScatterPlot" Plug-in, the "3D Scatterplot" Plug-in, and the "PathwayMapper" Plug-in. Additional custom plug-ins can be added at runtime or if you are hosting your own servers to host NG-CHMS. See the Developers Resources page for more information on creating and using custom plug-ins.
Each plug-in panel will contain a gear menu in the panel header next to the main panel menu icon that will open up the configuration dialog to allow you to change the configuration parameters for that panel. The corresponding configuration dialog will be opened automatically whenever a panel is changed to one of the plug-in panel types.
UMAP / 2D ScatterPlot Plug-in
The plot consists of a UMAP / 2 dimensional plot of the points from the NG-CHM determined by the configuration dialog below.
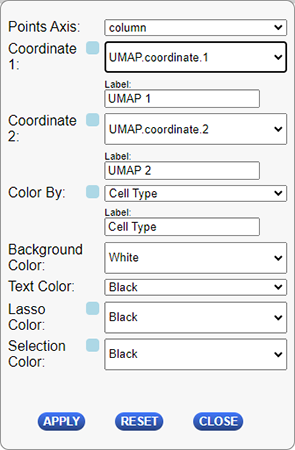
The following table describes the configuration options for this plug-in.
| Configuration Option | Description |
|---|---|
| Points Axis | Which axis you will using for coordinate selection. Options are column or row. This will determine which covariates or selected points are available for the coordinate 1, coordinate 2, and color by dropdowns below. |
| Label - Coordinate 1 | Label of the x-axis (columns) on the plot. By default this will be the name of the selected “Coordinate 1” covariate. |
| Coordinate 1 | Dropdown used to select the data to use for the plot’s x-axis (columns). The dropdown will contain a list of all covariates defined for the selected “Points Axis” above and an additional option of using the currently selected items from the matrix along that axis. |
| Label - Coordinate 2 | Label of the y-axis (rows) on the plot. By default this will be the name of the selected “Coordinate 2” covariate. |
| Coordinate 2 | Dropdown used to select the data to use for the plot’s y-axis (rows). The dropdown will contain a list of all covariates defined for the selected “Points Axis” above and an additional option of using the currently selected items from the matrix along that axis. |
| Color By | Dropdown to select how to color the points displayed on the plots. The colors of the points on the selected covariate or the selected points will be used to color the points on the plot. |
| Label - Color By | The label to display on the legend of the plot. By default this will be the name of the selected “Color By” covariate. |
| Background Color | The color of the background of the plot. |
| Lasso Color | The color to use when selecting points with the lasso tool. |
| Selection Color | The color used to display which points on the plot are selected. |
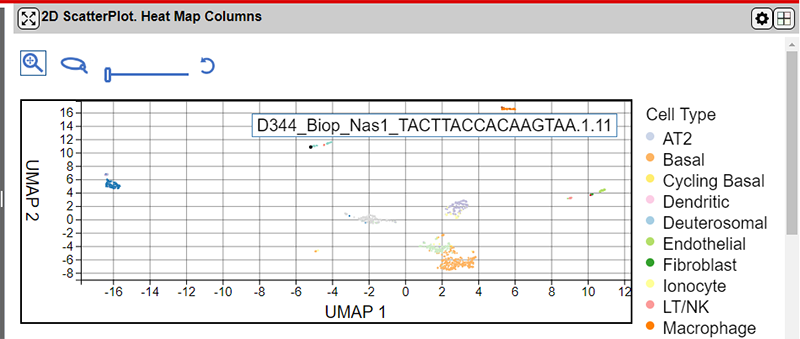
The interface provides 4 controls above the main plot area for controlling the plot.
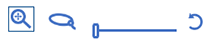
From left to right the tools are as follows:
| Control | Description |
|---|---|
| Zoom/Pan Mode Button * | Zoom in or out on the plot using the mouse wheel and pan on the map by holding down the mouse left button and dragging the map. |
| Lasso / Select Mode Button * | Drag a shape on the main plot area to select points. Hold down the control button to select more than one lasso region. |
| Point Size Slider Control | Drag the slider left or right to change the size of the points on the plot. |
| Reset Control | Press the control to reset the zoom and pan settings to the plot defaults. |
*You can switch between the Zoom/Pan and Lasso tools by pressing the s key.
Selecting points using the lasso tool will also select the corresponding points in all panels in the NG-CHM.
3D ScatterPlot Plug-in
The plot consists of a 3 dimensional plot of the points from the NG-CHM determined by the configuration dialog below.
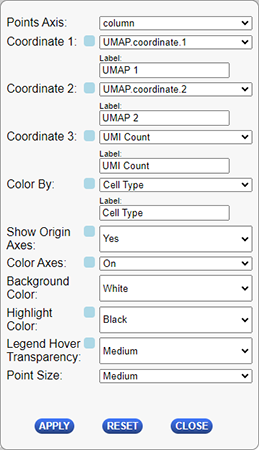
The following table describes the configuration options for this plug-in.
| Configuration Option | Description |
|---|---|
| Points Axis | Which axis you will using for coordinate selection. Options are column or row. This will determine which covariates or selected points are available for the coordinate 1-3, and color by dropdowns below. |
| Label - Coordinate 1 | Label of the x-axis on the plot. By default this will be the name of the selected “Coordinate 1” covariate. |
| Coordinate 1 | Dropdown used to select the data to use for the plot’s x-axis (columns). The dropdown will contain a list of all covariates defined for the selected “Points Axis” above and an additional option of using the currently selected items from the matrix along that axis. |
| Label - Coordinate 2 | Label of the y-axis on the plot. By default this will be the name of the selected “Coordinate 2” covariate. |
| Coordinate 2 | Dropdown used to select the data to use for the plot’s y-axis (rows). The dropdown will contain a list of all covariates defined for the selected “Points Axis” above and an additional option of using the currently selected items from the matrix along that axis. |
| Label - Coordinate 3 | Label of the z-axis on the plot. By default this will be the name of the selected “Coordinate 3” covariate. |
| Coordinate 3 | Dropdown used to select the data to use for the plot’s z-axis (rows). The dropdown will contain a list of all covariates defined for the selected “Points Axis” above and an additional option of using the currently selected items from the matrix along that axis. |
| Show Origin Axes | Determines whether or not to display the axes going through the origin (0,0,0) point on the 3 dimensional plot. Options are Yes and No. |
| Color Axes | Dropdown to select if the axes shulod be colored different colors or all be displayed as grey. Options are “On”=Color the axes different colors, and “Off”-Display all axes as grey. |
| Background Color | The color of the background of the plot. |
| Legend Hover Transparency | How to display the highlighted entries when the user hovers over the legend of the plot. Options are : Medium, Complete, Dark, Faint, None. |
| Point Size | The size used to display points on the plot. |
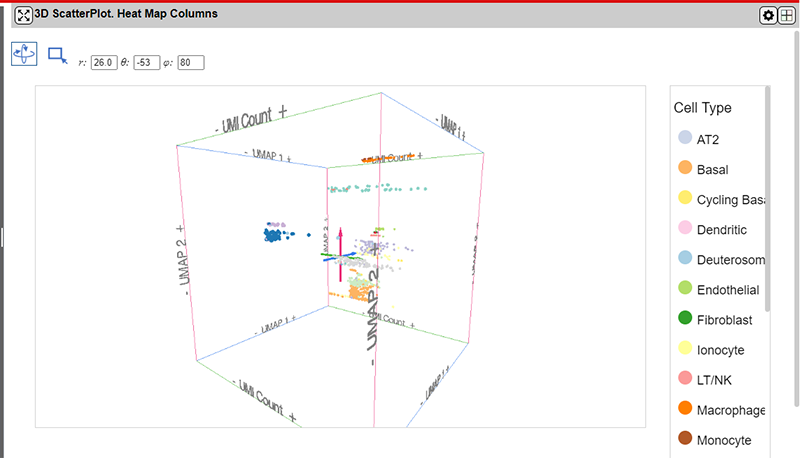
The interface provides 5 controls above the main plot area for controlling the plot.
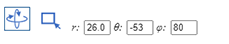
From left to right the tools are as follows:
| Control | Description |
|---|---|
| Rotate Mode Button * | Zoom in or out on the plot using the mouse wheel and rotate the map by holding down the mouse left button and dragging the map. |
| Select Mode Button * | Drag a shape on the main plot area to select points. |
| Rotation Angle controls | The three text boxes control the rotation about the three axes. They will be updated automatically when the plot is rotated using the mouse. Rotation values can also be entered manually to provide more exact control of the view in 3D space. |
*You can switch between the Zoom/Rotate and Select tools by pressing the s key.
Selecting points using the drag-selection tool will also select the corresponding points in all panels in the NG-CHM.
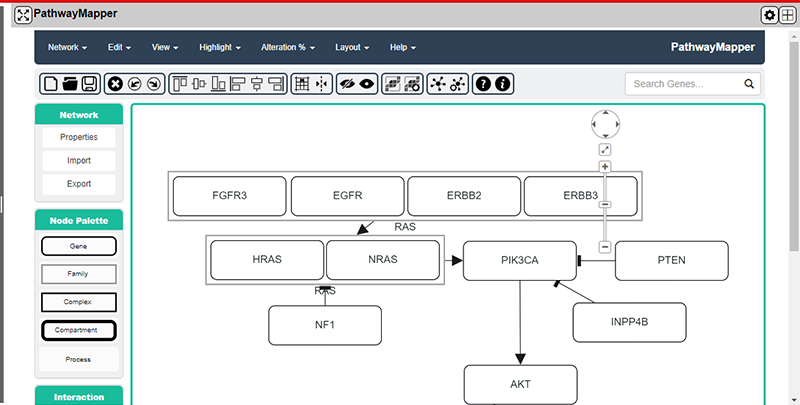
Pathway Mapper Plug-in
The Pathway Mapper plug-in is a tool for visualizing the data in the NG-CHM by adding a collaborative visual web editor for cancer pathways and genomic data. The plug-in is a fork of the Sloan Kettering PathwayMapper tool. PathwayMapper is a web based pathway curation tool for interactive creation, editing, and sharing of cancer pathways. The plug-in uses the PathwayMapper tool to pull data from the NG-CHM and augment selected genes on the pathway using tests run against the data from the NG-CHM.
The configuration dialog for this plug-in is displayed below.
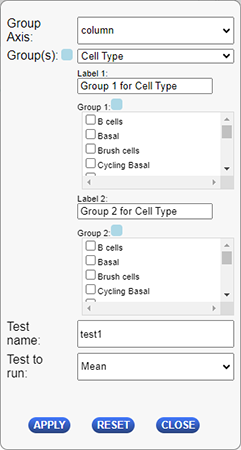
The following table describes the configuration options for this plug-in.
| Configuration Option | Description |
|---|---|
| Group Axis | Which axis you will using for group selection. Options are column or row. |
| Groups | Dropdown used to select the data for use in the tests. The dropdown will contain a list of all covariates defined for the selected “Group Axis” above and an additional option of using the currently selected items from the matrix along that axis. |
| Label - Group 1 | Label of group 1 on the plug-in. By default this will be the name of the selected “Group 1” covariate below. |
| Group 1 | Selection of values to use in group 1. |
| Label - Group 2 | Label of group 2 on the plug-in. By default this will be the name of the selected “Group 2” covariate below. |
| Group 2 | Selection of values to use in group 2. |
| Test Name | Name for the test run against the selected values above. |
| Test to run | Name of the test to run against the selected data. Current options are Mean and T-test. |
The full functionality of this tool is beyond the scope of this site. More information on the available features can be found in the associated paper describing the tool.
Within the plug-in panel, the changes that have been made include adding calculated values collected from the NG-CHM and adding them to the matching genes that are dispalyed in the selected pathway displayed in the tool. See the desription for the "Test Name" configuration parameter in the configuration dialog section above.
Linkouts
The NG-CHM Viewer includes in its architecture a mechanism to supports link outs to other websites and tools. The linkots are configured to pass data to the other websites to enable searching for selected data in those websites and tools either in a new browser tab and/or in some cases inside a Linkout Panel inside the NG-CHM panels area. These features can enable acces to tools that can help to better understand and explain the data in the NG-CHMs.
NGCHM Linkouts for Bioinformatics Researchers
You can enhance your NGCHM experience by leveraging a range of plugins that provide seamless integration with various genomic and bioinformatics databases.
The various linkouts that are available for a particular NG-CHM will vary dependent on the type of data the NG-CHM is defined to contain. i.e. If one of the axes is defined to be genes, then the gene related linkouts will be available for the rows of genes selected in the NG-CHM.
Here’s a brief explanation of each of the NG-CHM linkouts:
Amigo Gene Ontology Database
Linking to Amigo allows you to explore gene ontology information directly from your heatmap, providing insights into gene functions, biological processes, and molecular functions relevant to your data.
BioGPS Gene Annotation Portal
BioGPS annotations help you quickly obtain gene-related information such as expression profiles, functional annotations, and pathway data, making your heatmap more informative and context-rich.
Cancer Digital Slide Archive - TCGA Digital Slide Images
This plugin enables you to view digital pathology slides from TCGA directly linked to your heatmap data, facilitating a visual correlation between genomic alterations and histopathological features.
cBioPortal - Cancer Genomics
Integrate cBioPortal data to access comprehensive cancer genomics datasets. This allows for in-depth analysis of genetic mutations, expression changes, and other genomic features directly from your heatmap.
CIViC Mutation Database
Linking to CIViC provides clinically relevant information on cancer mutations, enhancing your ability to understand the clinical impact and relevance of genetic variations observed in your heatmap.
COSMIC - Catalogue of Somatic Mutations in Cancer
The COSMIC plugin allows you to explore somatic mutation data within your heatmap, helping you identify known cancer-associated mutations and their implications.
Decipher Database
Accessing the Decipher database through your heatmap helps you investigate genomic variants and their clinical significance, providing a deeper understanding of genetic aberrations in your data.
DepMap Portal
Integrate DepMap data to study cancer dependencies and vulnerabilities. This can aid in identifying potential therapeutic targets based on the dependencies highlighted in your heatmap.
Ensembl Genome Browser
Linking to Ensembl allows you to explore detailed genomic annotations and comparative genomics, enriching your heatmap data with extensive genomic context.
FireBrowse Portal
FireBrowse integration enables you to access and visualize TCGA data, making it easier to correlate your heatmap findings with publicly available cancer genomics data.
GDC Data Portal
The GDC plugin facilitates access to the Genomic Data Commons, allowing you to incorporate extensive cancer genomics datasets into your heatmap analysis.
GeneCards - Human Gene Card Database
GeneCards integration provides comprehensive gene annotations, including functional information, expression data, and disease associations, directly within your heatmap.
Google Scholar
Quickly search for literature related to specific genes or findings in your heatmap, facilitating a connection between your data and the broader scientific research.
GTEx Portal
Integrating GTEx data allows you to analyze tissue-specific gene expression patterns, helping you understand the biological context of your heatmap findings across different tissues.
Ideogram Viewer - Interactive Ideogram
Visualize sets of genes and miRNAs on an ideogram, providing a chromosomal context to your heatmap data and helping identify genomic regions of interest.
LinkedOmics Database
Linking to LinkedOmics allows you to explore multidimensional cancer data, integrating clinical and molecular data to gain comprehensive insights from your heatmap.
MaveDB Variant Effects Database
Accessing MaveDB helps you investigate the functional effects of genetic variants observed in your heatmap, providing a deeper understanding of their biological impact.
miRBase
Linking to miRBase allows you to explore microRNA data, enhancing your heatmap with information on miRNA functions and interactions.
MSigDB Pathways Database
Integrate MSigDB data to analyze curated pathways and gene sets, helping you interpret the biological pathways involved in your heatmap findings.
MuPIT Interactive
MuPIT integration allows you to visualize protein interaction networks, providing insights into the molecular interactions underlying your heatmap data.
MWannotation - Metabolomics Name
Accessing MWannotation helps you annotate metabolites in your heatmap, linking your data to comprehensive metabolomics resources.
NCBI Resources
The NCBI plugin provides access to a wide range of NCBI resources, including gene sequences, protein information, and bibliographic data, enriching your heatmap analysis.
NDEx IQuery
Integrate NDEx IQuery to explore network data, providing a systems biology perspective to your heatmap findings.
OLSVis Ontology Lookup Service
Linking to OLSVis allows you to access ontology terms and definitions, helping you annotate and interpret the functional aspects of your heatmap data.
MD Anderson Pathways Browser
Accessing the Pathways Browser facilitates pathway analysis, helping you identify pathway memberships and interactions relevant to your heatmap.
PeptideAtlas
Integrate PeptideAtlas data to access peptide and protein identification data, enriching your heatmap with proteomics information.
PubMed Portal
Quickly access relevant research articles from PubMed, providing a bibliographic context to the findings in your heatmap.
QuickGO Gene Ontology Browser
Link to QuickGO to explore gene ontology annotations, helping you understand the biological processes, cellular components, and molecular functions associated with your heatmap data.
Antibody RRID
Access antibody identification data, ensuring the reproducibility and accuracy of your experimental results linked to your heatmap.
TCGA - The Cancer Genome Atlas
Enhance your heatmap with comprehensive cancer genomics data from TCGA, providing a rich dataset for exploring cancer biology.
TumorPortal
Linking to TumorPortal helps you explore somatic mutations in cancer, aiding in the identification of key genetic alterations in your heatmap data.
UCSC Genome Browser
Integrate UCSC Genome Browser data to access a wide range of genomic annotations, enhancing the contextual information available in your heatmap.
UniProt Protein Database
Access comprehensive protein information from UniProt, providing detailed annotations and functional information relevant to your heatmap.
Vega Genome Browser
Link to the Vega genome browser for detailed gene annotations, adding depth to your genomic analysis.
Pathways Toolbox - Analyze Gene Labels for Pathway Membership
Use the Pathways Toolbox to analyze gene labels for pathway memberships, helping you identify and understand the pathways involved in your heatmap data.
Saving and Exporting
The NG-CHM Viewer allows mutiple options for saving some or all of the data in a NG-CHM. You can save a local copy of the NG-CHM with all of the changes you have made through the viewer to a local file, save all or selected data from the main matrix in the NG-CHM to a local file, save selected label data, or send all or selected portions of the data on the NG-CHM to our online interactive GUI Builder to create a new NG-CHM. The sections below describe how to use these options to extract the data you want from the NG-CHM.
Save and View a Local Copy of an NG-CHM
The NG-CHM Viewer is generally run by opening a heat map on a website or by visualizing an NG-CHM heat map in Galaxy. If you want to customize and save a copy of a heat map or if you want to view heatmaps without installing the heat map on a web server, you can save a local copy of a heat map and view it with a locally installed copy of the NG-CHM Viewer. Changes made through the configuration panel are saved to the local copy of the heat map. Heat maps are stored as a collection of files compressed into a zip file with a file extension of ".ngchm".
To save an NG-CHM as a stand-alone file, right click on the main menu at the top right of the viewer and select the "Save Heat Map Changes ..." menu option.

You should then see a dialog like this one.

If you have full rights to the heat map, you can either save the changes to the server using the “Save Original” button so that all users will see your updated version of the heat map or you can just save a local copy of the changes to your computer using the “Save to .ngchm” button. If the heat map is read-only, you will only have the option of saving a local copy. Depending on your browser settings, you will either be prompted for the location where you would like to save the heat map or it will go to the browser Downloads folder.
While the .ngchm file is downloading you will see a dialog with a progress bar of the download."

After downloading the heat map, a second dialog will allow you to install a local copy of the NG-CHM Viewer if you do not yet have it on your computer.

Select the Download Viewer button on the next dialog to download a local copy of the viewer. Again you will be prompted for where you would like to save the ngChmApp.html file or it will go to your browser's Downloads folder. Just double-click on the ngChmApp.html file to run the viewer in your browser.
Finally, to open any map that you have stored on your machine, click the "Choose File"" button in the viewer to select the .ngchm file. This will open the heat map in the local NG-CHM viewer.

Exporting Data from the NG-CHM Viewer
You have several options for exporting data from the current NG-CHM. You can save data to your local drive or upload it to the Online NG-CHM GUI Builder. This will allow you to change features of the NG-CHM like the clustering options or transform the data in ways that are not available in the NG-CHm Viewer software.
All of these options can be utilized by right-clicking on the main matrix of a detail view in the NG-CHM. This will bring up a dialog with the following options:
| Menu Option | Description |
|---|---|
| Upload selected NG-CHM data to the builder | This will upload only the currently selected data to the online interactive NG-CHM GUI Builder. |
| Upload all NG-CHM data to the builder | This will upload all the data in the current NG-CHM to the online interactive NG-CHM GUI Builder. |
| Download selected matrix data to file | This will download the selected data of the main matix of the file to a tab-delmited text file. This will include the data labels but will not include data for the NG-CHM covarites. |
| Download all matrix data to file | This will download all of the data for the main matix of the file to a tab-delmited text file. This will include the data labels but will not include data for the NG-CHM covarites. |
| Copy selected labels to clipboard | This will open a new browser window and copy the labels for the selected rows and columns to that window. Labels will appear in the same order they appeared on the NG-CHM with one entry per line. |
Exporting selected Column or Row Labels
If you wish to view or save just the names of the selected row or column labels from the NG-CHM, you can right click on one of the labels on that axis and select the "Copy selected lables to clipboard" menu option.
This will open a new browser window and copy the labels for the selected rows and columns to that window. Labels will appear in the same order they appeared on the NG-CHM with one entry per line.

Exporting NG-CHMs as High Resolution PDF Files
The NG-CHM Viewer allows you to easily export the Summary and Detail panels that are currently visible in your NG-CHM to a PDF file for use in high resolution publications.
To create the PDF, right click on the main menu at the top right of the viewer and select the “Save Heat Map as PDF…” menu option.

This will bring up the PDF Generation dialog which can be used to select how the PDF will be generated.

Here are the generation options available when creating the PDF.
| Generation Option | Description |
|---|---|
| Include maps | Include just the Summary Panel, just the Detail Panel[s], or both in the PDF. |
| Show detail view boundries on summary map | Each detail panel may display only a portion of the whole map matrix. If checked, the boundries for each detail panel will be drawn on the PDF like they are displayed on the summary map in the viewer. If unchecked, the boundries will not be displayed on the Summary Panel in the PDF. |
| Include covariate bar legends | You can choose if legends will be displayed for map covariates and in what format the legends will be displayed. |
| Condensed vs Histogram | Displayed legends will be displayed in the selected format. See example PDFs below to see how they differ. |
| Column | Determines if legends for column covariates will be displayed on the PDF. |
| Row | Determines if legends for row covariates will be displayed on the PDF. |
| Resolution | Select at what resolution the images on the PDF will be generated in dots per inch. The choices are 50 (the default), 100, 150, 300, 600, or Custom. If Custom is selected an additional entry field will appear to allow entry of a custom resolution. |
| Font Style | The font used for labels on the PDF. The options are Helvetica (default), Courier, and Times Roman. |
| Paper Size | The paper size of the PDF generation. The choices are Standard Letter (8.5 x 11 inches), Ledger/Tabloid (11 x 17 inches), and A4 International (210 x 297 mm). |
| Orientation | Whether to generate the PDF in Portrait or Landscape orientation. |
After choosing your options, clicking the Create PDF button will display up a progress bar indicator to indicate the progress of the generation. Very high resolution PDFs and PDFs for very large maps may take a while to create.
Here are two examples of two generated PDFs at the default settings with condensed legends and for histogram legends for comparison.
The PDF output from the NG-CHM Viewer creates its PDF based on the panels on the visible screen. The NG-CHM GUI Builder can create a higher resolution PDF image of the summary map with all columns labeled. See the entry for the “Get Expanded PDF” button on the View Heat Map page of the NG-CHM GUI Builder documentation for more information on creating that detailed PDF of the Summary Panel portion of the map.